A React Dashboard Template Powered By Elasticsearch
](https://cdn-images-1.medium.com/max/2000/1*drhzFD_OL51gSvRCxpD_wg.gif)
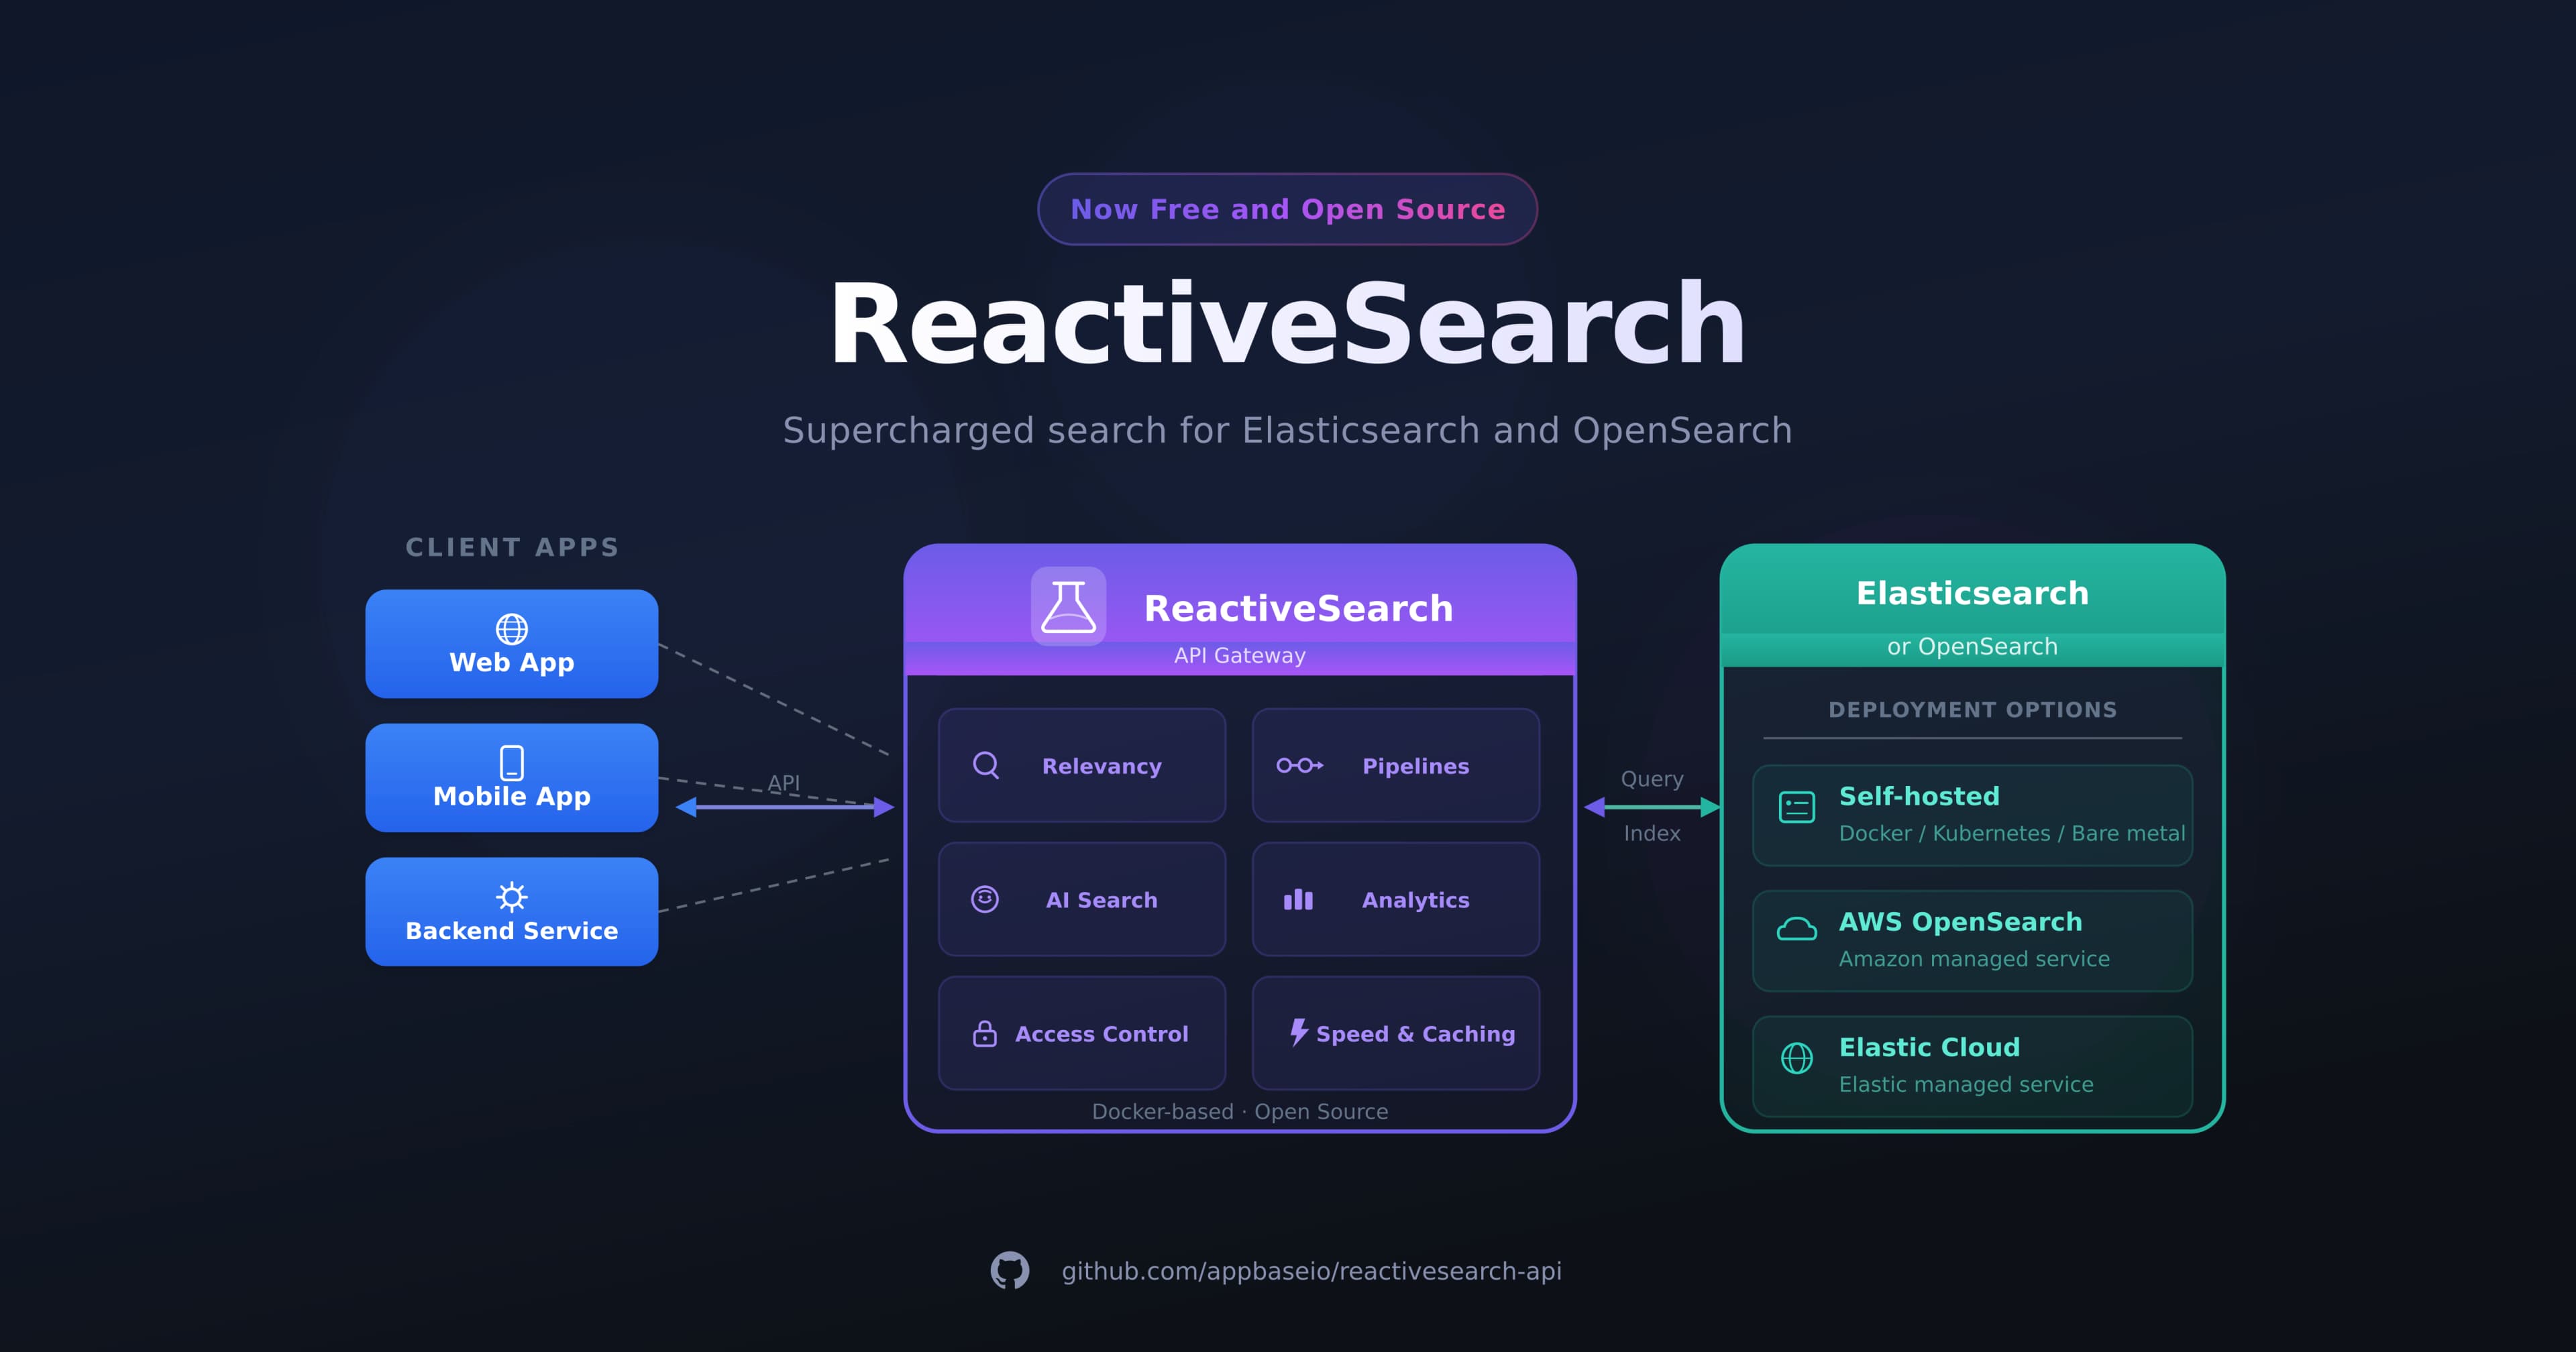
Are you looking for a ready-to-use and performant boilerplate for your next SaaS dashboard or BI dashboard project? Perhaps with advanced search capabilities! 🤩 That's what we will talk about in this post. We have created a React dashboard template that is powered by an ElasticSearch backend and uses Recharts / ApexCharts for rendering the charts UI widgets. You can change the UI component libraries easily to connect with your own dataset.
In addition to providing the template code in this post, we will also go over how it works using an open-source code example so that you can also create a dashboard UI of your own from the ground up without purchasing this template.
Yet Another Dashboard Template
While there are many templates available for mock dashboards, they miss out on the most important aspect of using a dashboard. A dashboard exists to enable you to:
Tailor the data visualizations for your business case,
Visualize data from a backend source. And what better would be a source be than ElasticSearch — the #1 open-source search and analytics engine that can scale without limiting you down the road,
Configure the existing UI widgets and be able to add new widgets with ease — ReactiveSearch, our choice of the underlying library here for querying ElasticSearch enables you to do exactly this.
For a dashboard project, performance is a key metric. Elasticsearch (and its Apache 2.0 alternative: OpenSearch) offer state of the art performance for millions of data points.
With these needs in mind, our data-driven dashboard’s boilerplate comes pre baked with:
An Elasticsearch backend that’s configurable to your own choice of ES backend and the dataset,
ReactiveSearch — A declarative, props-driven UI library for querying and managing the search state and comes with over 30 UI component presets. This lets you customize both your queries and UIs to render in minutes and comes with extensive documentation,
Recharts and Apexcharts for rendering the charts UIs. They come with a comprehensive selection of charts. You can either add more charts from these easily or replace them entirely with other charting libraries such as d3.js, highcharts, or Victory,
Auth0 for the login and authorization functionality. This is easy to extend and tailor for your use case. You can also choose to replace Auth0 with another OAuth provider such as Firebase,
A map UI (which is also data-driven) that is rendered using react-simple-maps. You can also extend this and/or replace it with a Google Maps / OpenStreetMap based maps UI.
You can buy the entire template now for $99 over here. The template comes with a walkthrough video and you get free updates and support for the next 6 months.
](https://cdn-images-1.medium.com/max/2000/1*8p8V8w3EcQMIUBTZyFhd2g.gif)
Who Is This For
The need for the overall representation of data in a single glance is an essential requirement for all businesses. That’s where a dashboard comes into play. The ability for a company to now use real-time graphs and charts that clearly display how key aspects of their business are performing — has gone from a convenient ‘nice to have’ to a ‘must have’.
A dashboard can be used to:
Enable your business team to visualize the important business metrics in a single glance,
Share performance and ROI reports with your clients,
Empower your customers and end-users to visualize metrics relevant to them,
Collate existing dashboards into a unifying dashboard.
There are dashboard builder tools such as Kibana and Grafana which let you create Elasticsearch powered dashboards with no code. We recommend them whenever they fit your use case. However, they become limiting as soon as you need:
A chart that’s not available in their walled garden,
Need to programmatically filter and visualize the data, e.g. filter data for the logged-in user and set access controls on the data that’s visible,
Need to integrate other JavaScript code within your dashboard, or extend further by calling other backend routes.
What’s Inside This Template
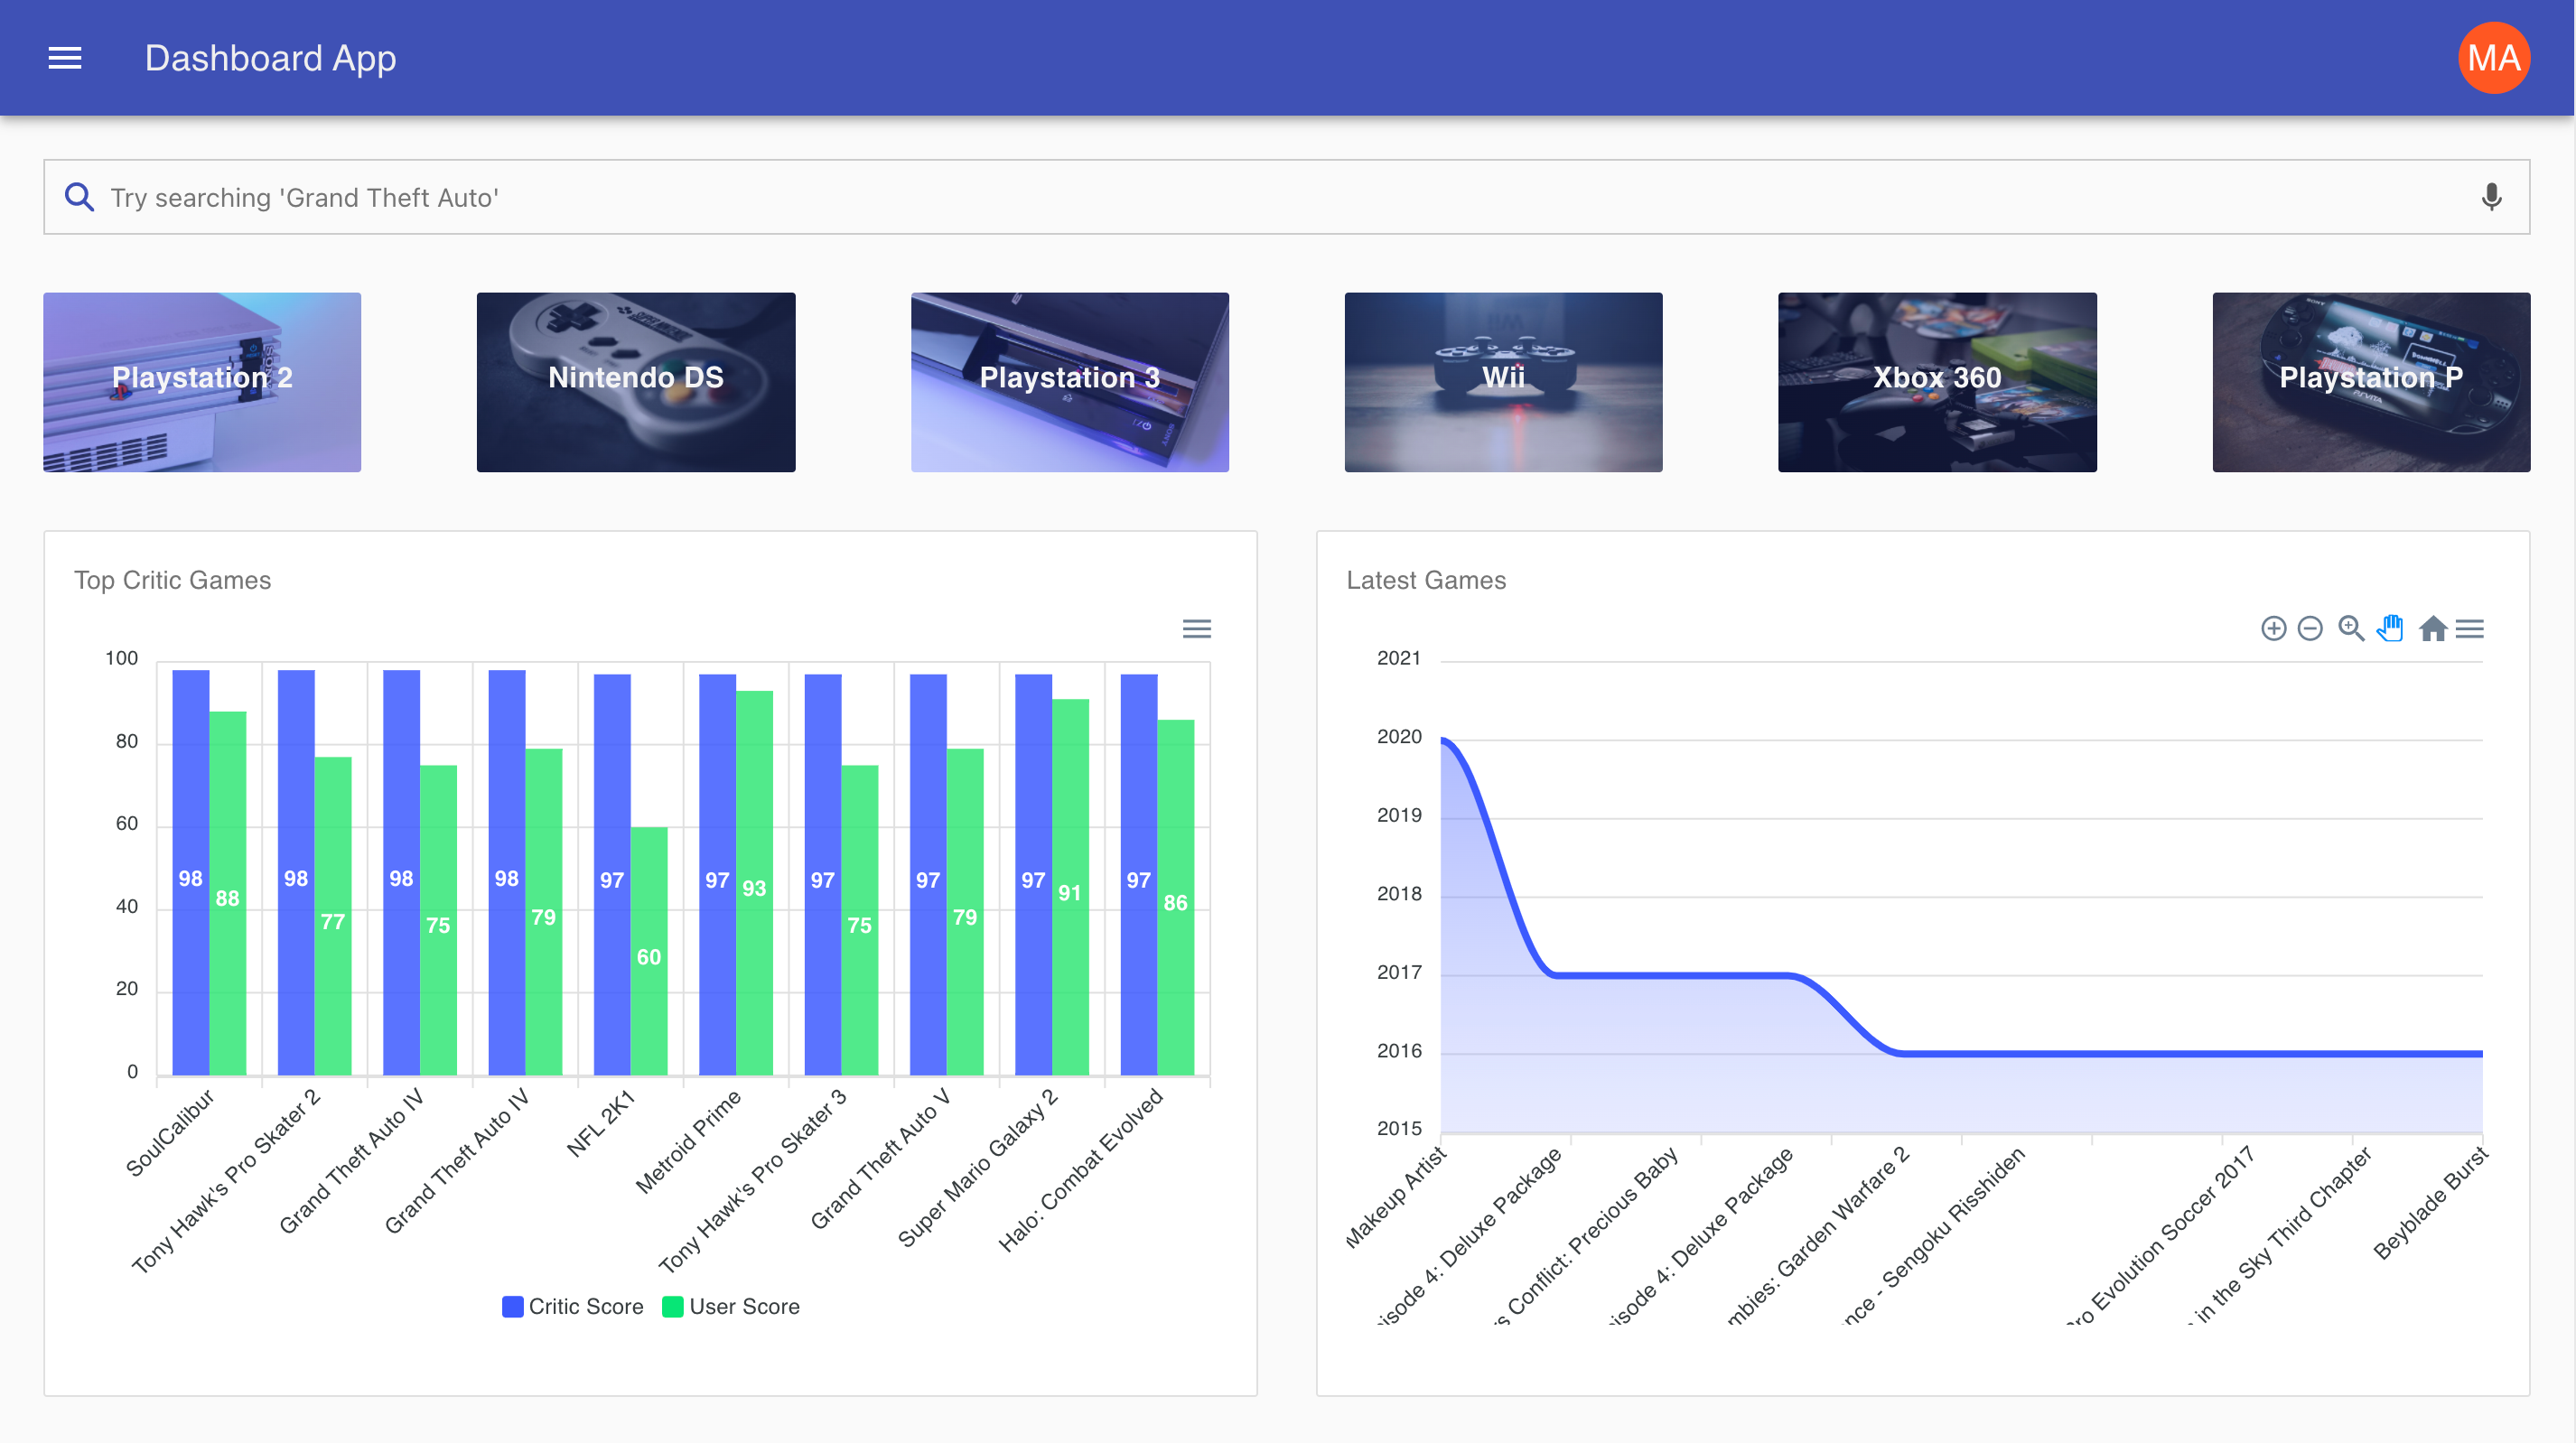
This template comes with a dataset that sales data of games published over the years. It contains data visualizations powered by recharts and apexcharts. We use ElasticSearch for powering the search (aggregations) backend here and the template is using the ReactiveSearch library to fetch the hits and then render the charts using recharts.
Tools and libraries we have used in this app:
Auth0 for Authentication
Material-UI is used for the design system
Appbase.io for hosting Elasticsearch
ReactiveSearch for querying Elasticsearch with a props-driven interface
ApexCharts, Recharts, and react-simple-maps for visualizing data via charts UIs,
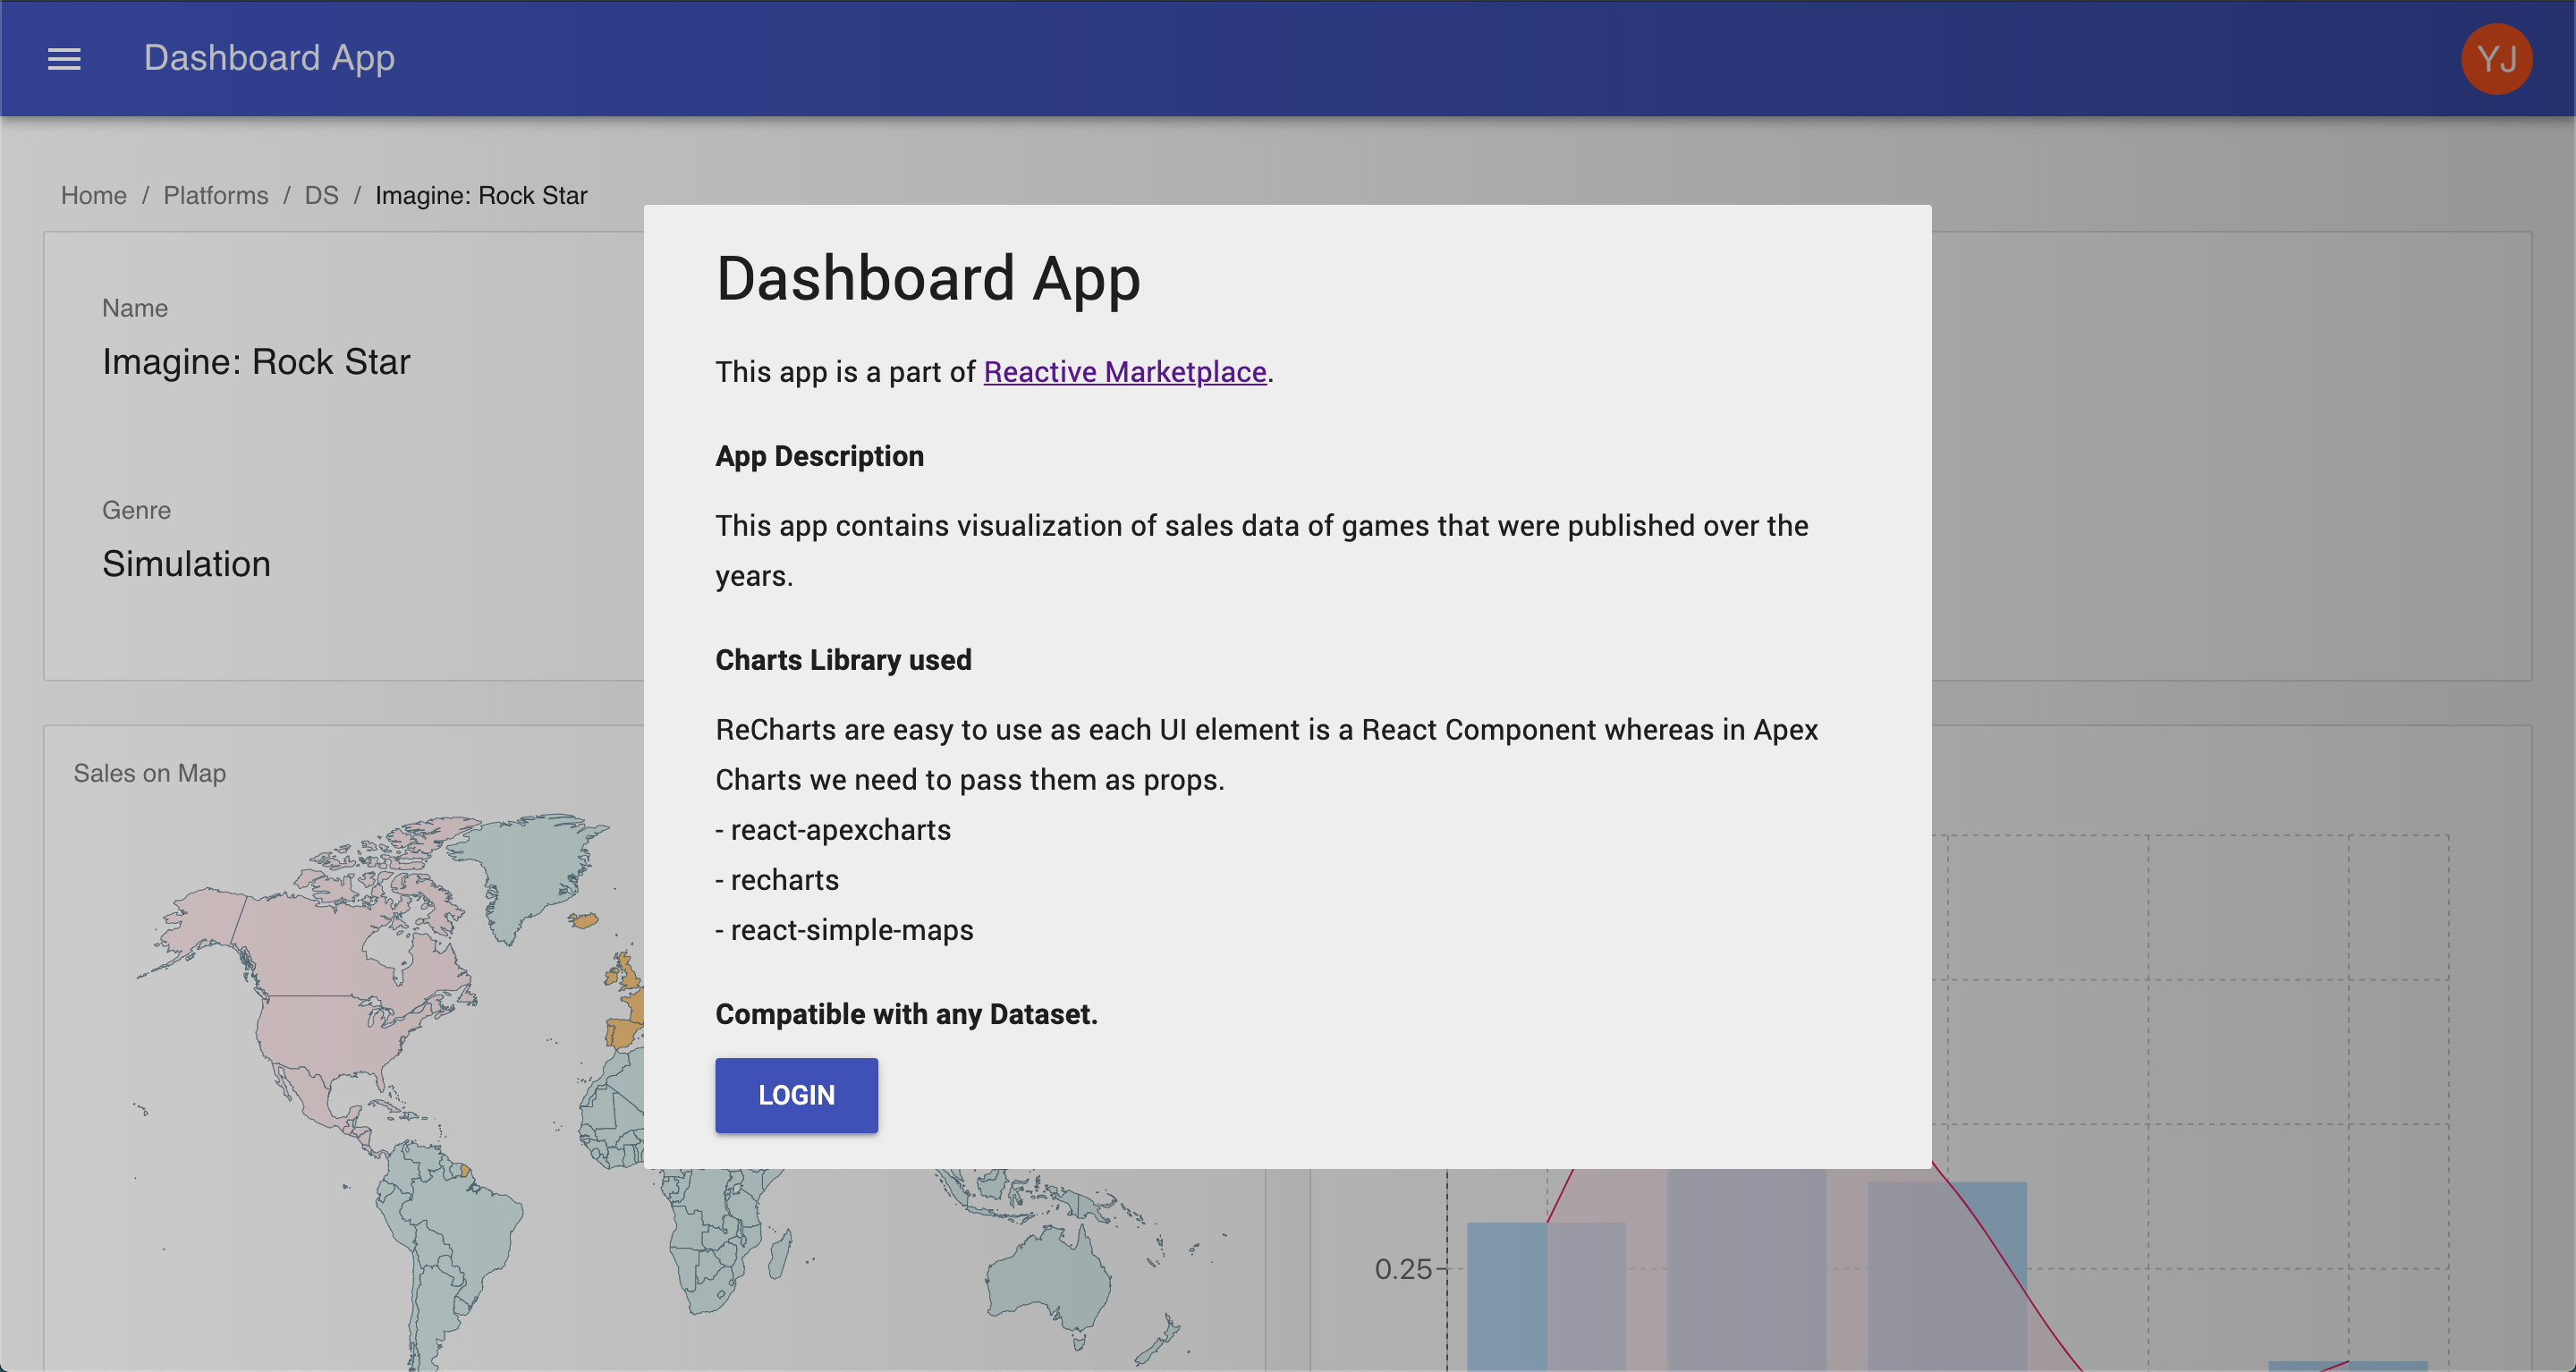
Authentication with Auth0
In this app, we have used Auth0’s library to integrate the authentication flow. It also supports password-less authentication using social login such as Google.
Auth0 supports industry standards such as SAML, OpenID Connect, JSON Web Token, OAuth 2.0, OAuth 1.0a, WS-Federation, and OpenID. Also, Auth0’s widget(UI) gives you a fully customizable, enterprise-ready login/registration box with just a few lines of JavaScript. You can learn more about it over here — https://auth0.com/why-auth0/.
Note: In the template’s source code, you’ll have to replace existing Auth0 credentials with your ones. AUTH0_CLIENT and AUTH0_DOMAIN are the variables responsible for passing credential values to Auth0 API.
Design System (Material-UI)
The core design system that we have used in this app is Material UI (https://material-ui.com/) which provides React components and is used by thousands of developers. Dashboard UI’s integral elements like grids, layouts, cards, and various visual elements are built using Material UI.
ReactiveSearch
We have used ReactiveSearch for querying Elasticsearch using declarative props. It comes with a rich API for customizing the queries and comes with over 20 UI component presets.
Data Visualization (Apex Charts, Recharts, react-simple-maps)
We have combined set visualizations containing:
Charts & Graphs — We are using Apex Charts react.js wrapper for building customizable charts. For introducing more variety, we have used the Recharts library.
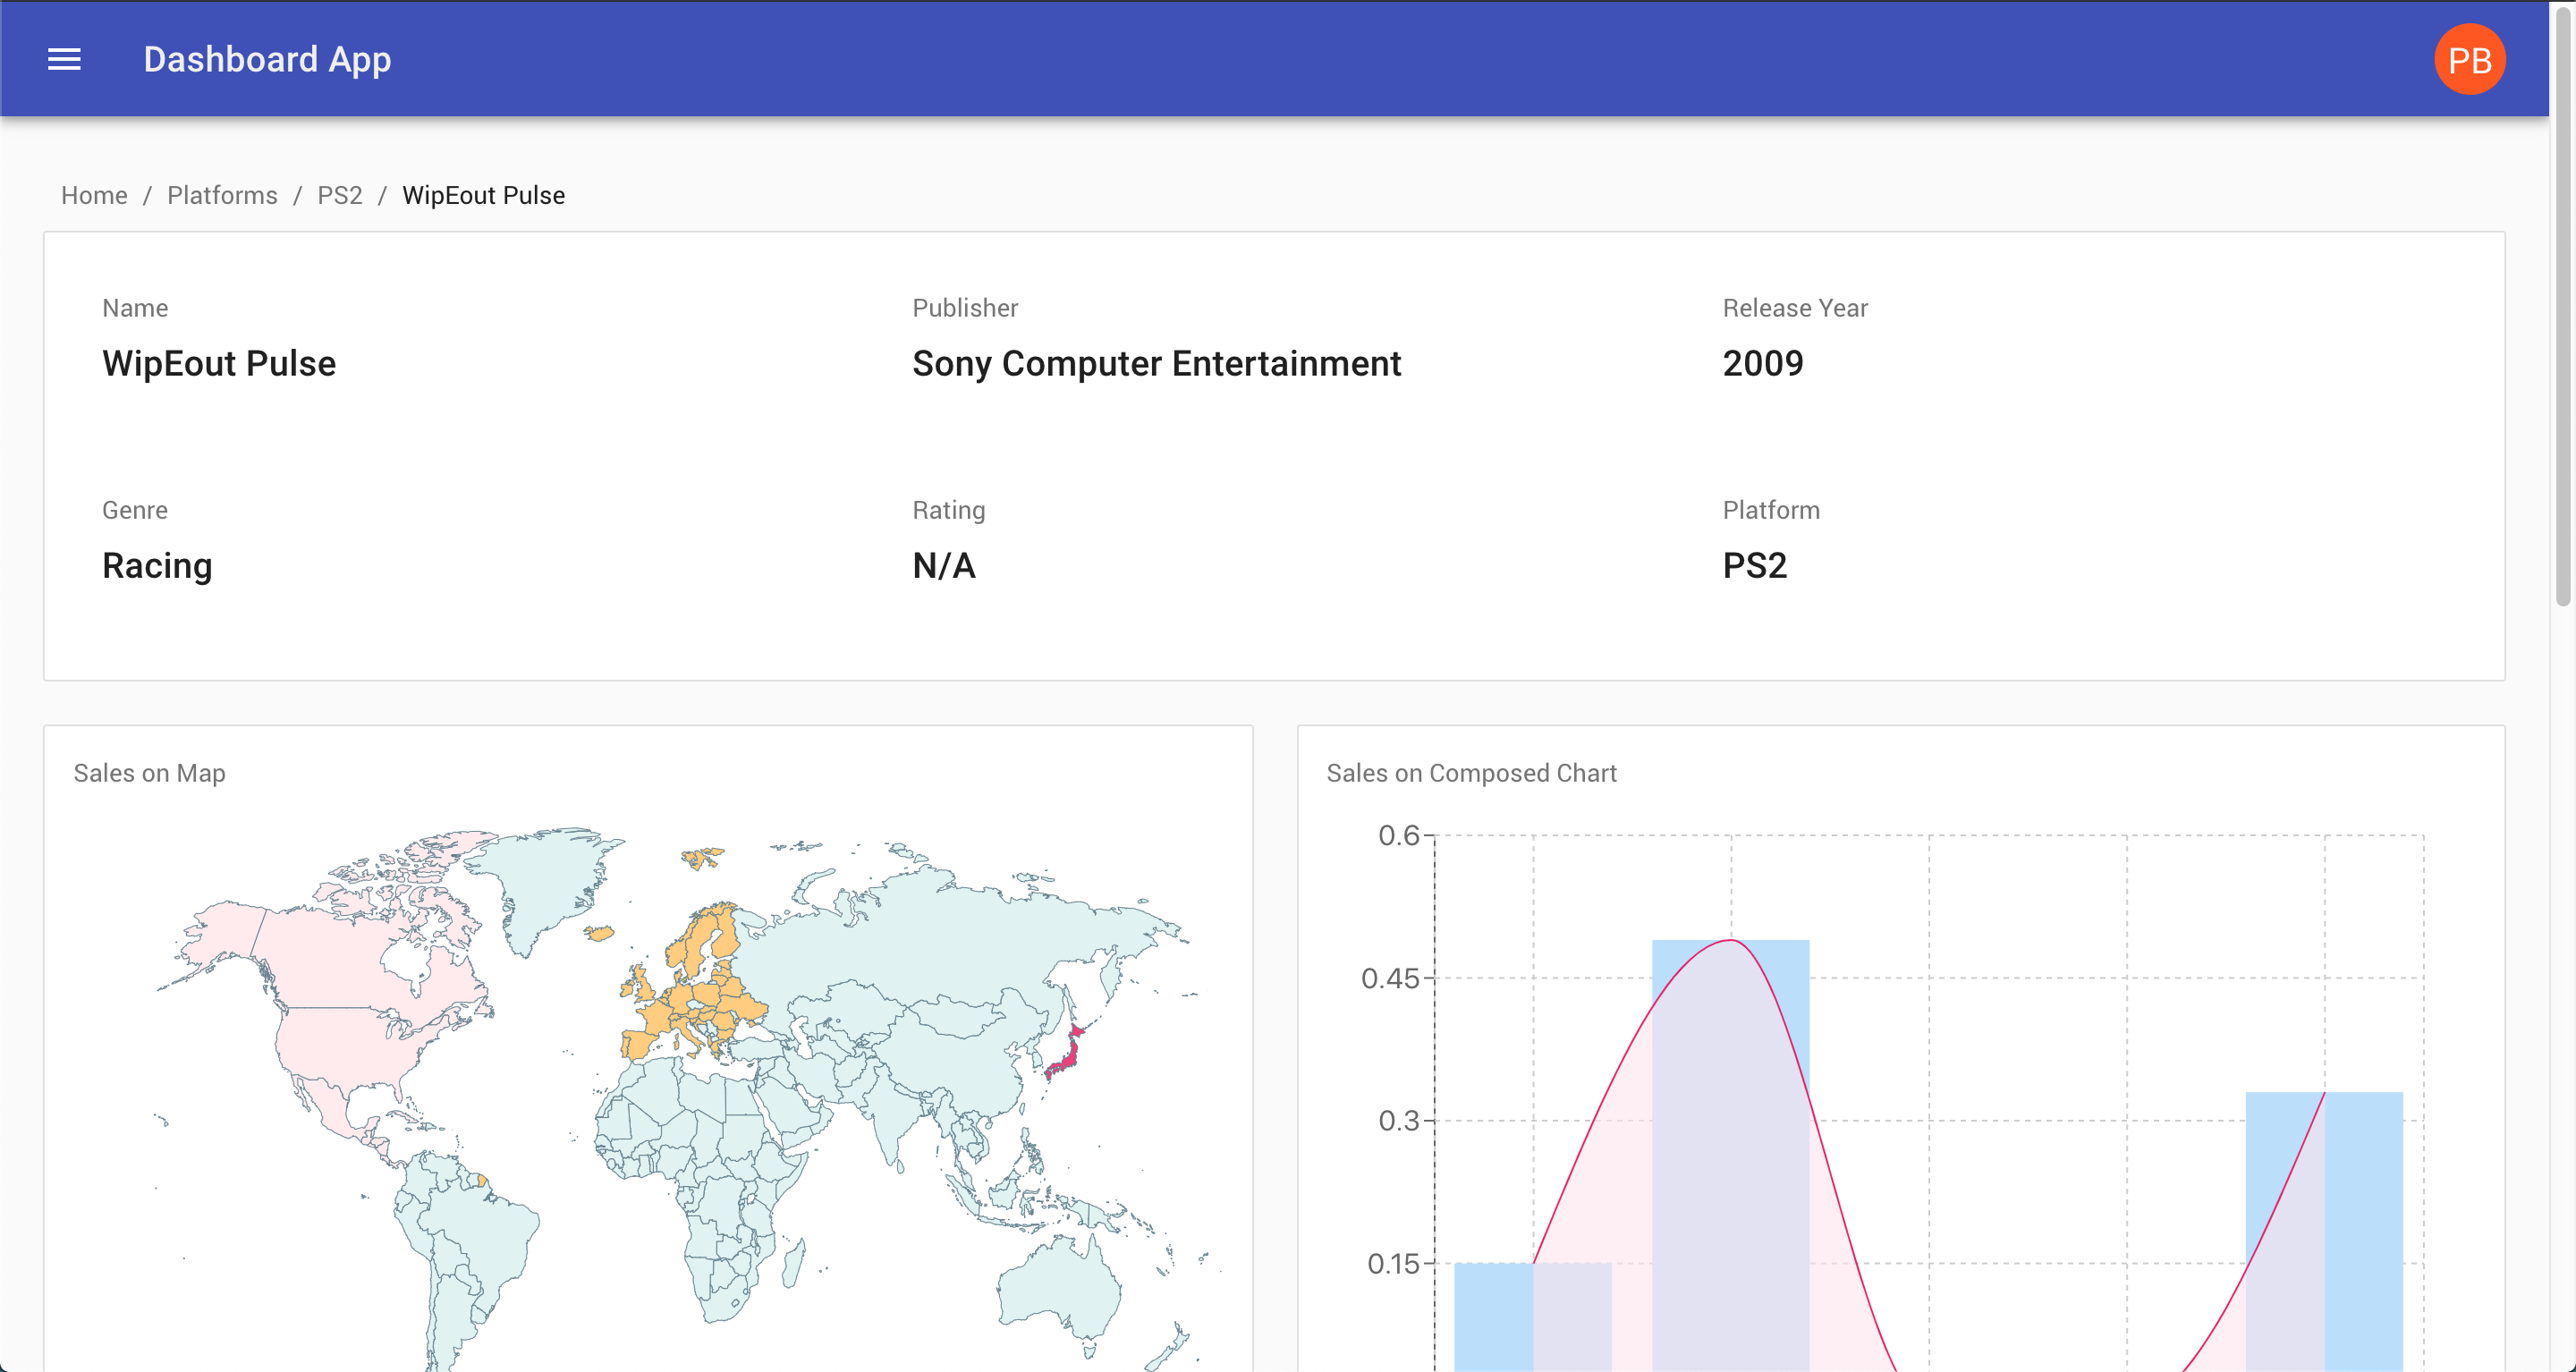
Maps — We are using react-simple-maps package for displaying a map based on the sales by geography (see image below).
Screenshots

Try It Live
You can try it out live over here — https://charts-dashboard.netlify.com/.
How To Use Elasticsearch With React
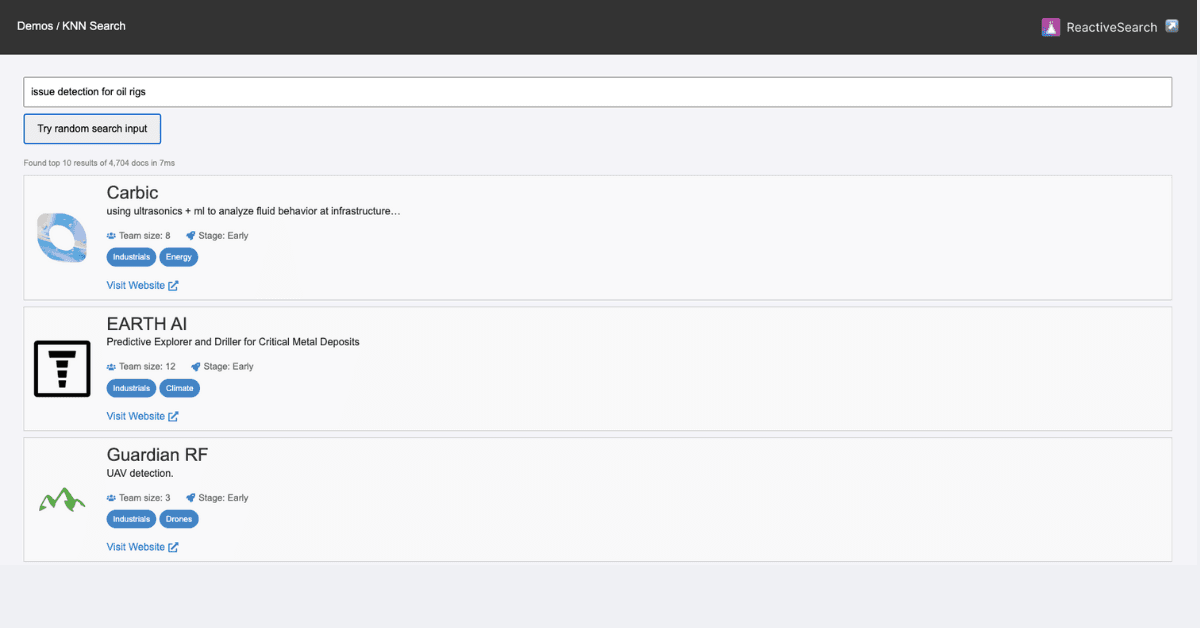
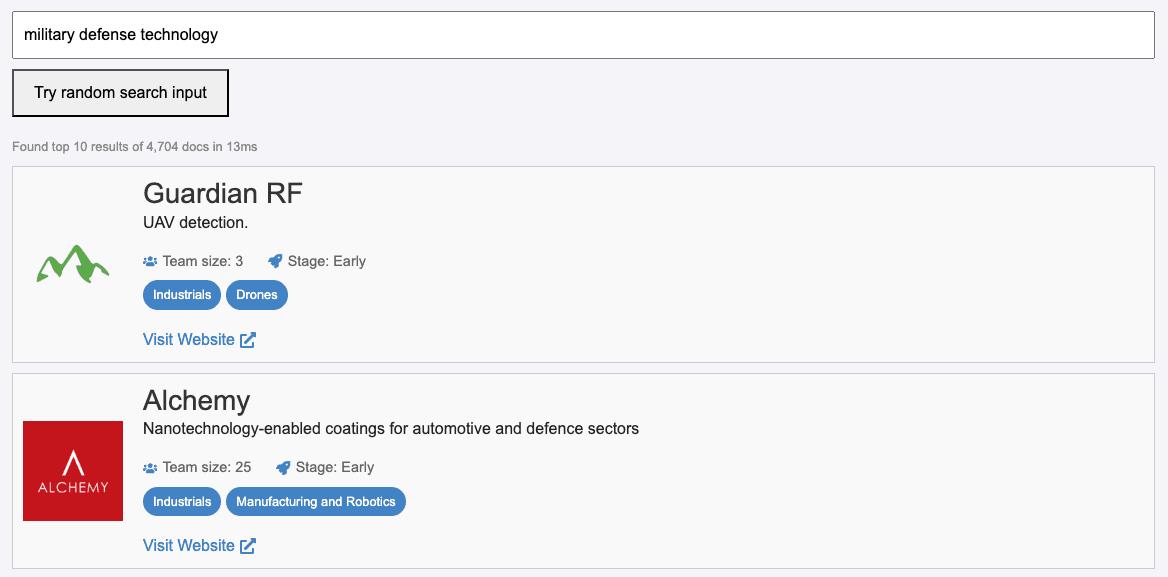
We have used ReactiveSearch — an open-source library to build the data-driven components in this template. It offers a range of highly customizable rich UI components that can connect with any Elasticsearch server and provide you with good default queries for all the typical search use-cases (think e-commerce, aggregators, events).
Components Used:
ReactiveBase — All the ReactiveSearch components are wrapped inside a container component — ReactiveBase which glues the ElasticSearch index and the ReactiveSearch components together.
Read more about it over here.
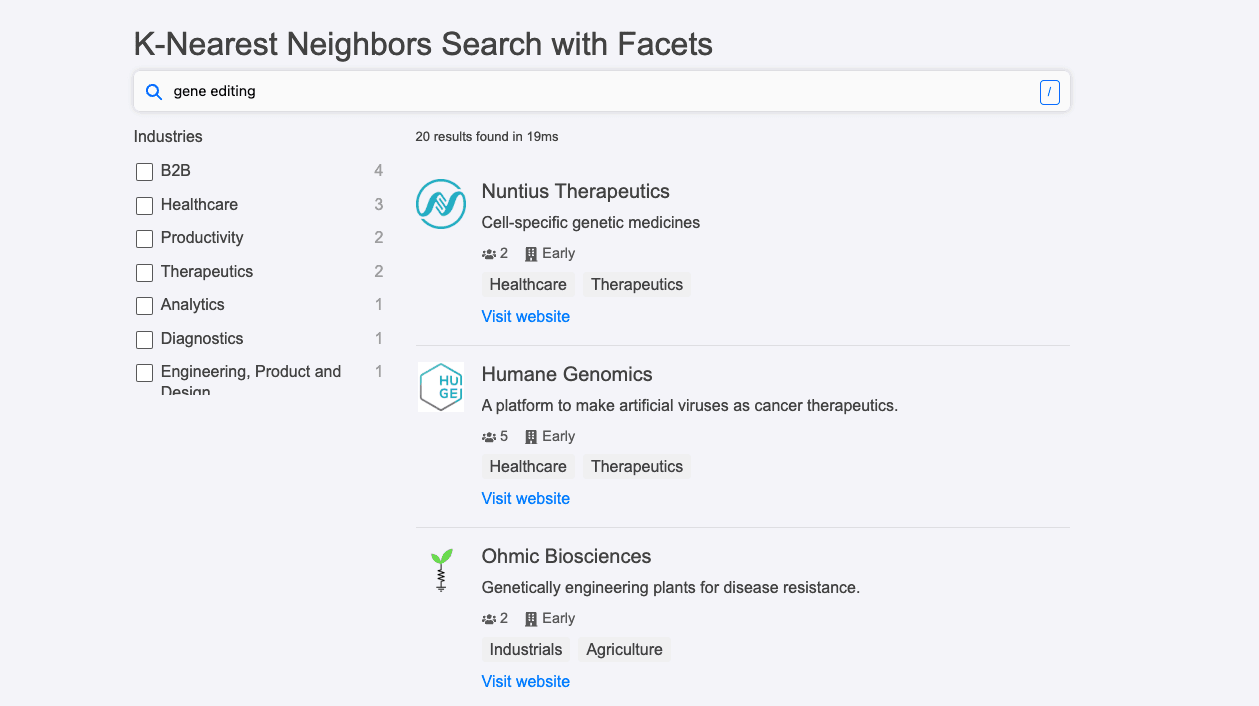
SearchBox — This component creates a search bar UI that allows a user to search for data inside the dashboard.

Read more about it over here.
DynamicRangeSlider — This component displays a range(automatically calculated) and helps a user filter data by specific fields, e.g. a filter by year. Additionally, displays a histogram depicting the aggregation of data.
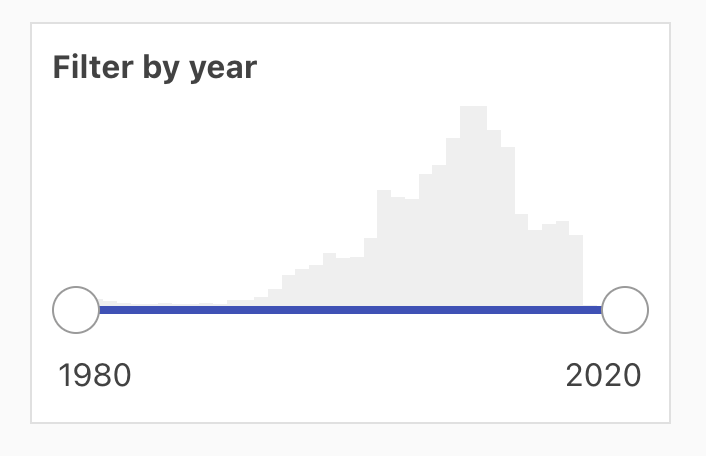
Read more about it over here.
ReactiveList — This component is used for rendering the result list view.

Read more about it over here.
ReactiveComponent — This component is responsible for connecting custom react components to ElasticSearch on top of ReactiveSearch.
We have used it to embed chart components with ReactiveSearch layer.
Read more about it over here.
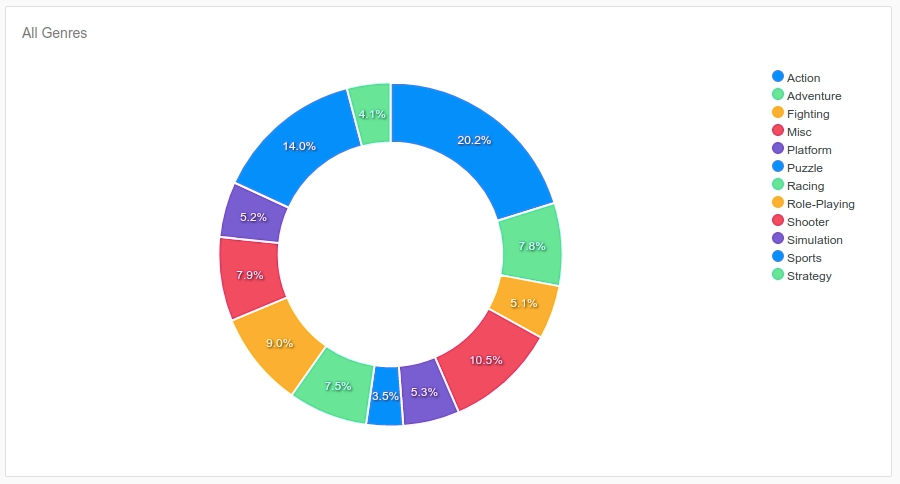
If you are more curious about how to use ReactiveComponent to build custom data-driven components, here’s an example of building a Donut Chart using it:
Summary
If you are finding challenges in building a performant and data-driven dashboard and want to do it in less time, then this template app can help you set up one with minimum effort so you can focus on your core business as the foremost priority.
Compatible with your dataset 📦, Plug’n’Play extensible UI components 🔧, blazing-fast backend 🚀, instant search infrastructure ⚡️ and interactive data-visualizations 📊, this dashboard template app is the perfect starter for your product’s development.
💻 You can try it live over here.
❤️ Buy this template from here so you can build that awesome dashboard project in no time.