New UI components in Reactivesearch v4
Introducing TreeList, Charts and an ability to export search results in CSV and JSON
If you're reading this, then you might already be familiar with ReactiveSearch, an open-source library to create elegant search UIs. In the last few months, we've updated the library with some new UI components 🎉. I will be talking about two of them here, which you might want to use for your next search UI. One is a new component called TreeList which allows for hierarchical faceting with extensive customizability. Second is the ability to incorporate charts, either for faceting or for displaying aggregation data. And finally, there is the ability to allow end-users to export search results as CSV or JSON.
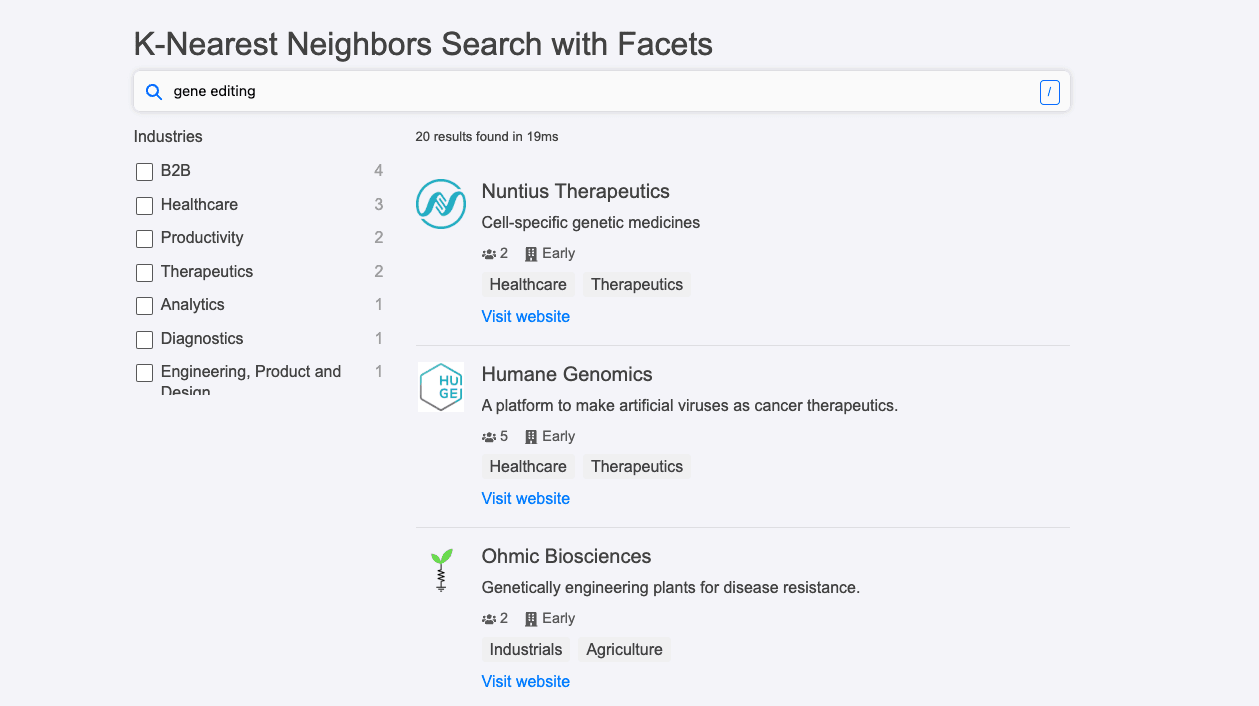
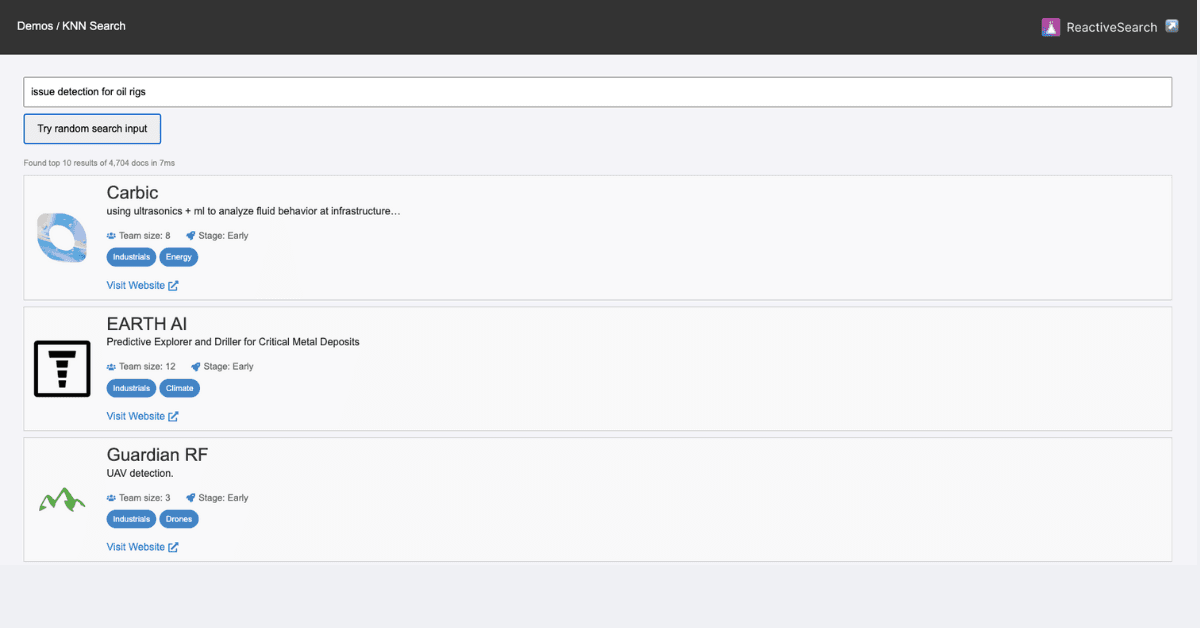
We will create a follow-along E-commerce search UI to show the usage of these features. You might want to build an e-commerce app with some specific use cases in mind. You can take a look at the live version below.
What would we need?
We would be using some tools to help make this complex task simple.
Dataset: To make a great UI we should have a good dataset. We would be using an e-commerce dataset that has a vast amount of product data across categories. We would also need an index to store the data.
You can set up and install an Elasticsearch server by following the official installation guide, or you can create a free account at reactivesearch.io which provides Elasticsearch hosting as a service and is easy to use. For simplicity, we will be using reactivesearch.io service to get started.
I’ve already created an index with the dataset. You can check out the dataset from above over here in the data browser tool Dejavu, which is built by reactivesearch.io.
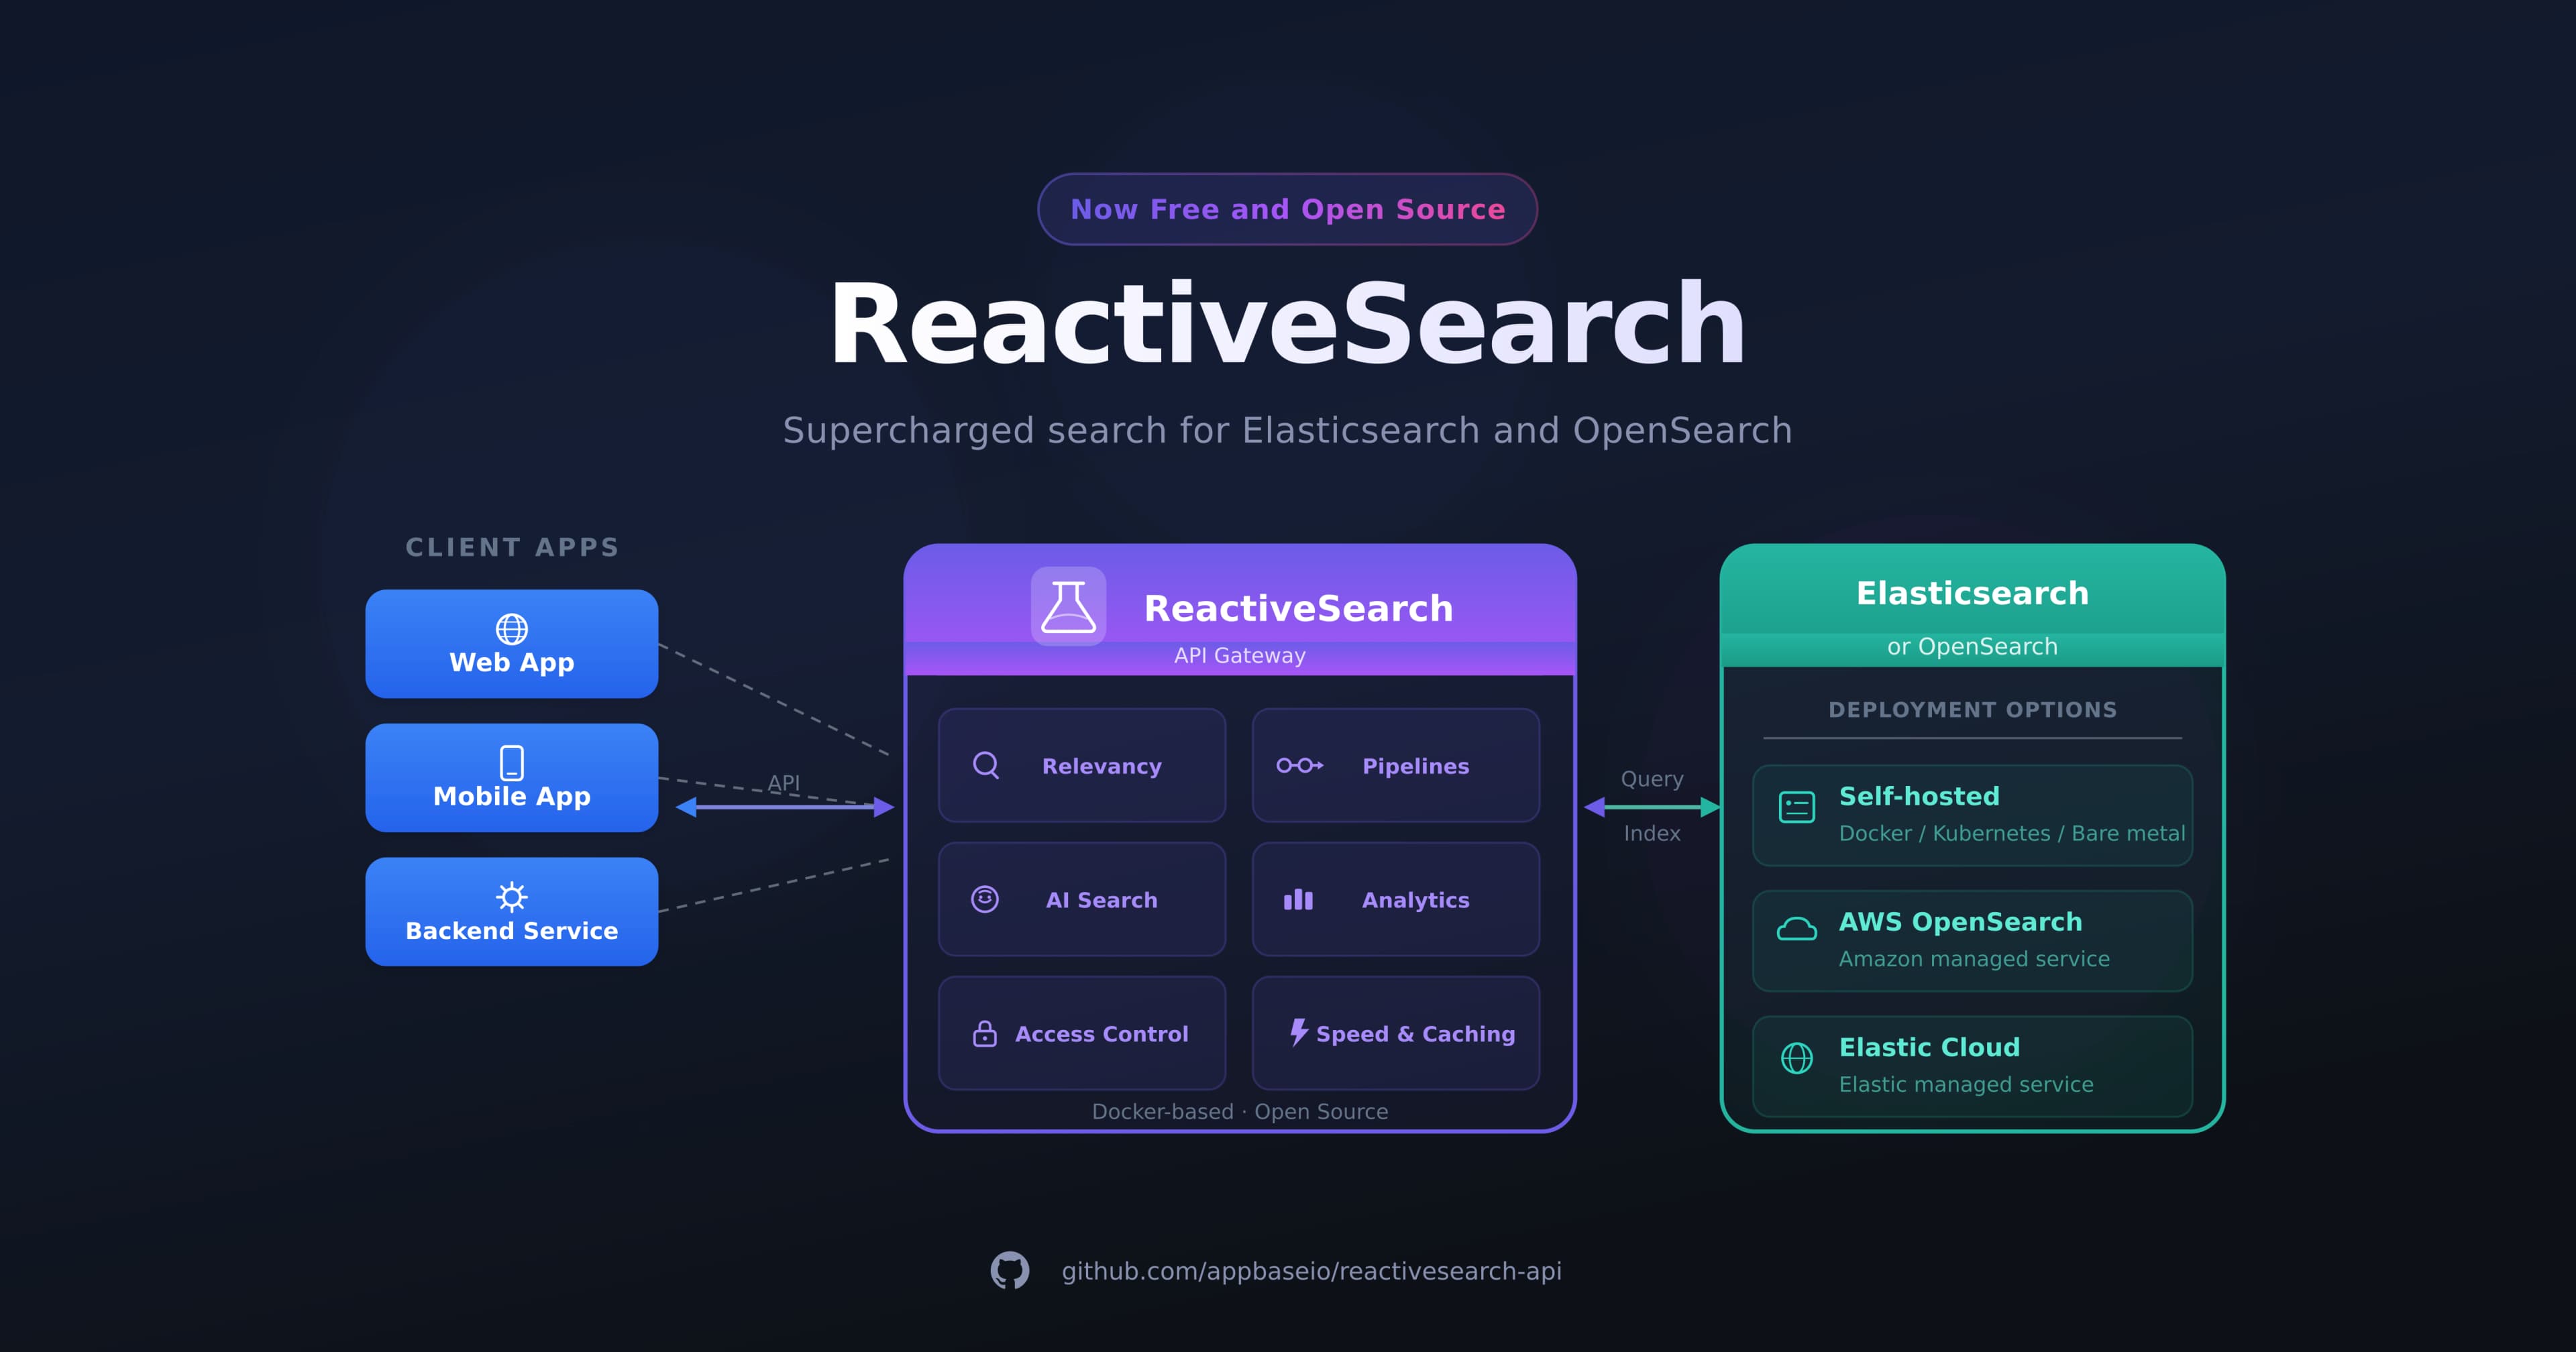
ReactiveSearch — A declarative, props-driven UI library for querying and managing the search state and comes with over 30 UI component presets. This lets you customize both your queries and UIs to render in minutes and comes with extensive documentation.
Antd: A UI components library so that we don't have to focus on making our UI beautiful and consistent.
Let's get started
Initial Setup
In order to run a react app we would need certain tools and configure them.
We can bootstrap a react project by running yarn create react-app [app-name] or npx create-react-app [app-name]. This would create a project directory and initialize a package.json file in the root with all the necessary packages and scripts.
We would also need to install antd library. This app was made using v4 of the library.
yarn add antd@4
You would also need to install @appbaseio/reactivesearch which would help us create the search UI.
yarn add @appbaseio/reactivesearch
Configuring Reactivesearch:
For building our app, we would first need to connect to the Elasticsearch index storing our dataset. For that, we would use ReactiveBase component from the library. The index name is best-buy-dataset and we have configured the credentials and URL. Since this is made using reactivesearch.io we are also passing enableAppbase to be true. We are doing this inside src/App.js.
// src/App.js
import { ReactiveBase } from "@appbaseio/reactivesearch";
import React from "react";

function App() {
  return (
    <ReactiveBase
      app="best-buy-dataset"
      url="https://a03a1cb71321:75b6603d-9456-4a5a-af6b-a487b309eb61@appbase-demo-ansible-abxiydt-arc.searchbase.io"
      enableAppbase
    >
    {/* Our App goes here */}
    </ReactiveBase>
  );
}
Showing the results:
We can show some results from the index to confirm our setup is working. For that, we are going to use another component called ReactiveList. Not only does it show results, but it also updates itself when one of the facets changes. It also gives us a nice interface to render data in our dataset.
We would add a ReactiveList by configuring it's componentId, dataField, and renderItem method. We've already seen what componentId and dataField do. As for the renderItem method, it is a method that passes down each individual document from the Elasticsearch index which you can use to customize the look and feel. Apart from that we also configure an additional property called react. This tells what facet components would update the results in this list. We should pass the componentId of the facets when doing this. You can read more about configuring ReactiveList component in the documentation.
// src/App.js
import { ReactiveBase } from "@appbaseio/reactivesearch";
import React from "react";

function App() {
  return (
    <ReactiveBase
      app="best-buy-dataset"
      url="https://a03a1cb71321:75b6603d-9456-4a5a-af6b-a487b309eb61@appbase-demo-ansible-abxiydt-arc.searchbase.io"
      enableAppbase
    >
      <ReactiveList
        componentId="SearchResult"
        dataField="original_title"
        renderItem={(data) => {
          return (
            <div key={data._id}>
              <img src={data.image} alt="Book Cover" />
              <div>
                <div className="book-header">{data.name}</div>
                <div className="flex column justify-space-between">
                  <div>
                    <div>
                      {data.class} > {data.subclass}
                    </div>
                    <div className="ratings-list flex align-center">
                      Sale price: <span>{data.salePrice}</span>
                    </div>
                  </div>
                </div>
              </div>
            </div>
          );
        }}
        react={{
          and: ["Category", "SubCategory", "Color", "ReviewAverage"],
        }}
      />
    </ReactiveBase>
  );
}
We can also add a SearchBox component to the above. We also added a navbar for improving the look and feel. You can check the app and source code in codesandbox below.
Adding facets:
This app would also contain different facets which we would use to narrow down our search results. We would be using @appbaseio/reactivesearch library which provides a range of facets.
We would make a new file CollapsibleFacets.js in src/components. We are going to add a chart facet. For this, we would use ReactiveChart component and pass it required props to show us a pie chart. componentId differentiates this facet from others. dataField determines the field in your dataset/index on which you want to query. Finally, chartType is the chart you want to render. It can be pie, bar, line, etc. You can look at how we can configure different chart facets in the documentation. We also use Collapse component from antd so we can show and hide the facet which can be convenient when there are several facets.
// src/components/CollapsibleFacets.js
import { ReactiveChart } from '@appbaseio/reactivesearch';
import { Collapse } from 'antd';

const { Panel: CollapsePanel } = Collapse;

export default function CollapsibleFacets() {
    return (
        <Collapse
            defaultActiveKey={
                ['Color']
            }
        >
            <CollapsePanel header={<h3>Color</h3>} key="Color">
                <ReactiveChart
                    componentId="Color"
                    dataField="color.keyword"
                    chartType="pie"
                    type="term"
                    URLParams
                    useAsFilter
                    loader="Loading..."
                />
            </CollapsePanel>
        </Collapse>
    );
}
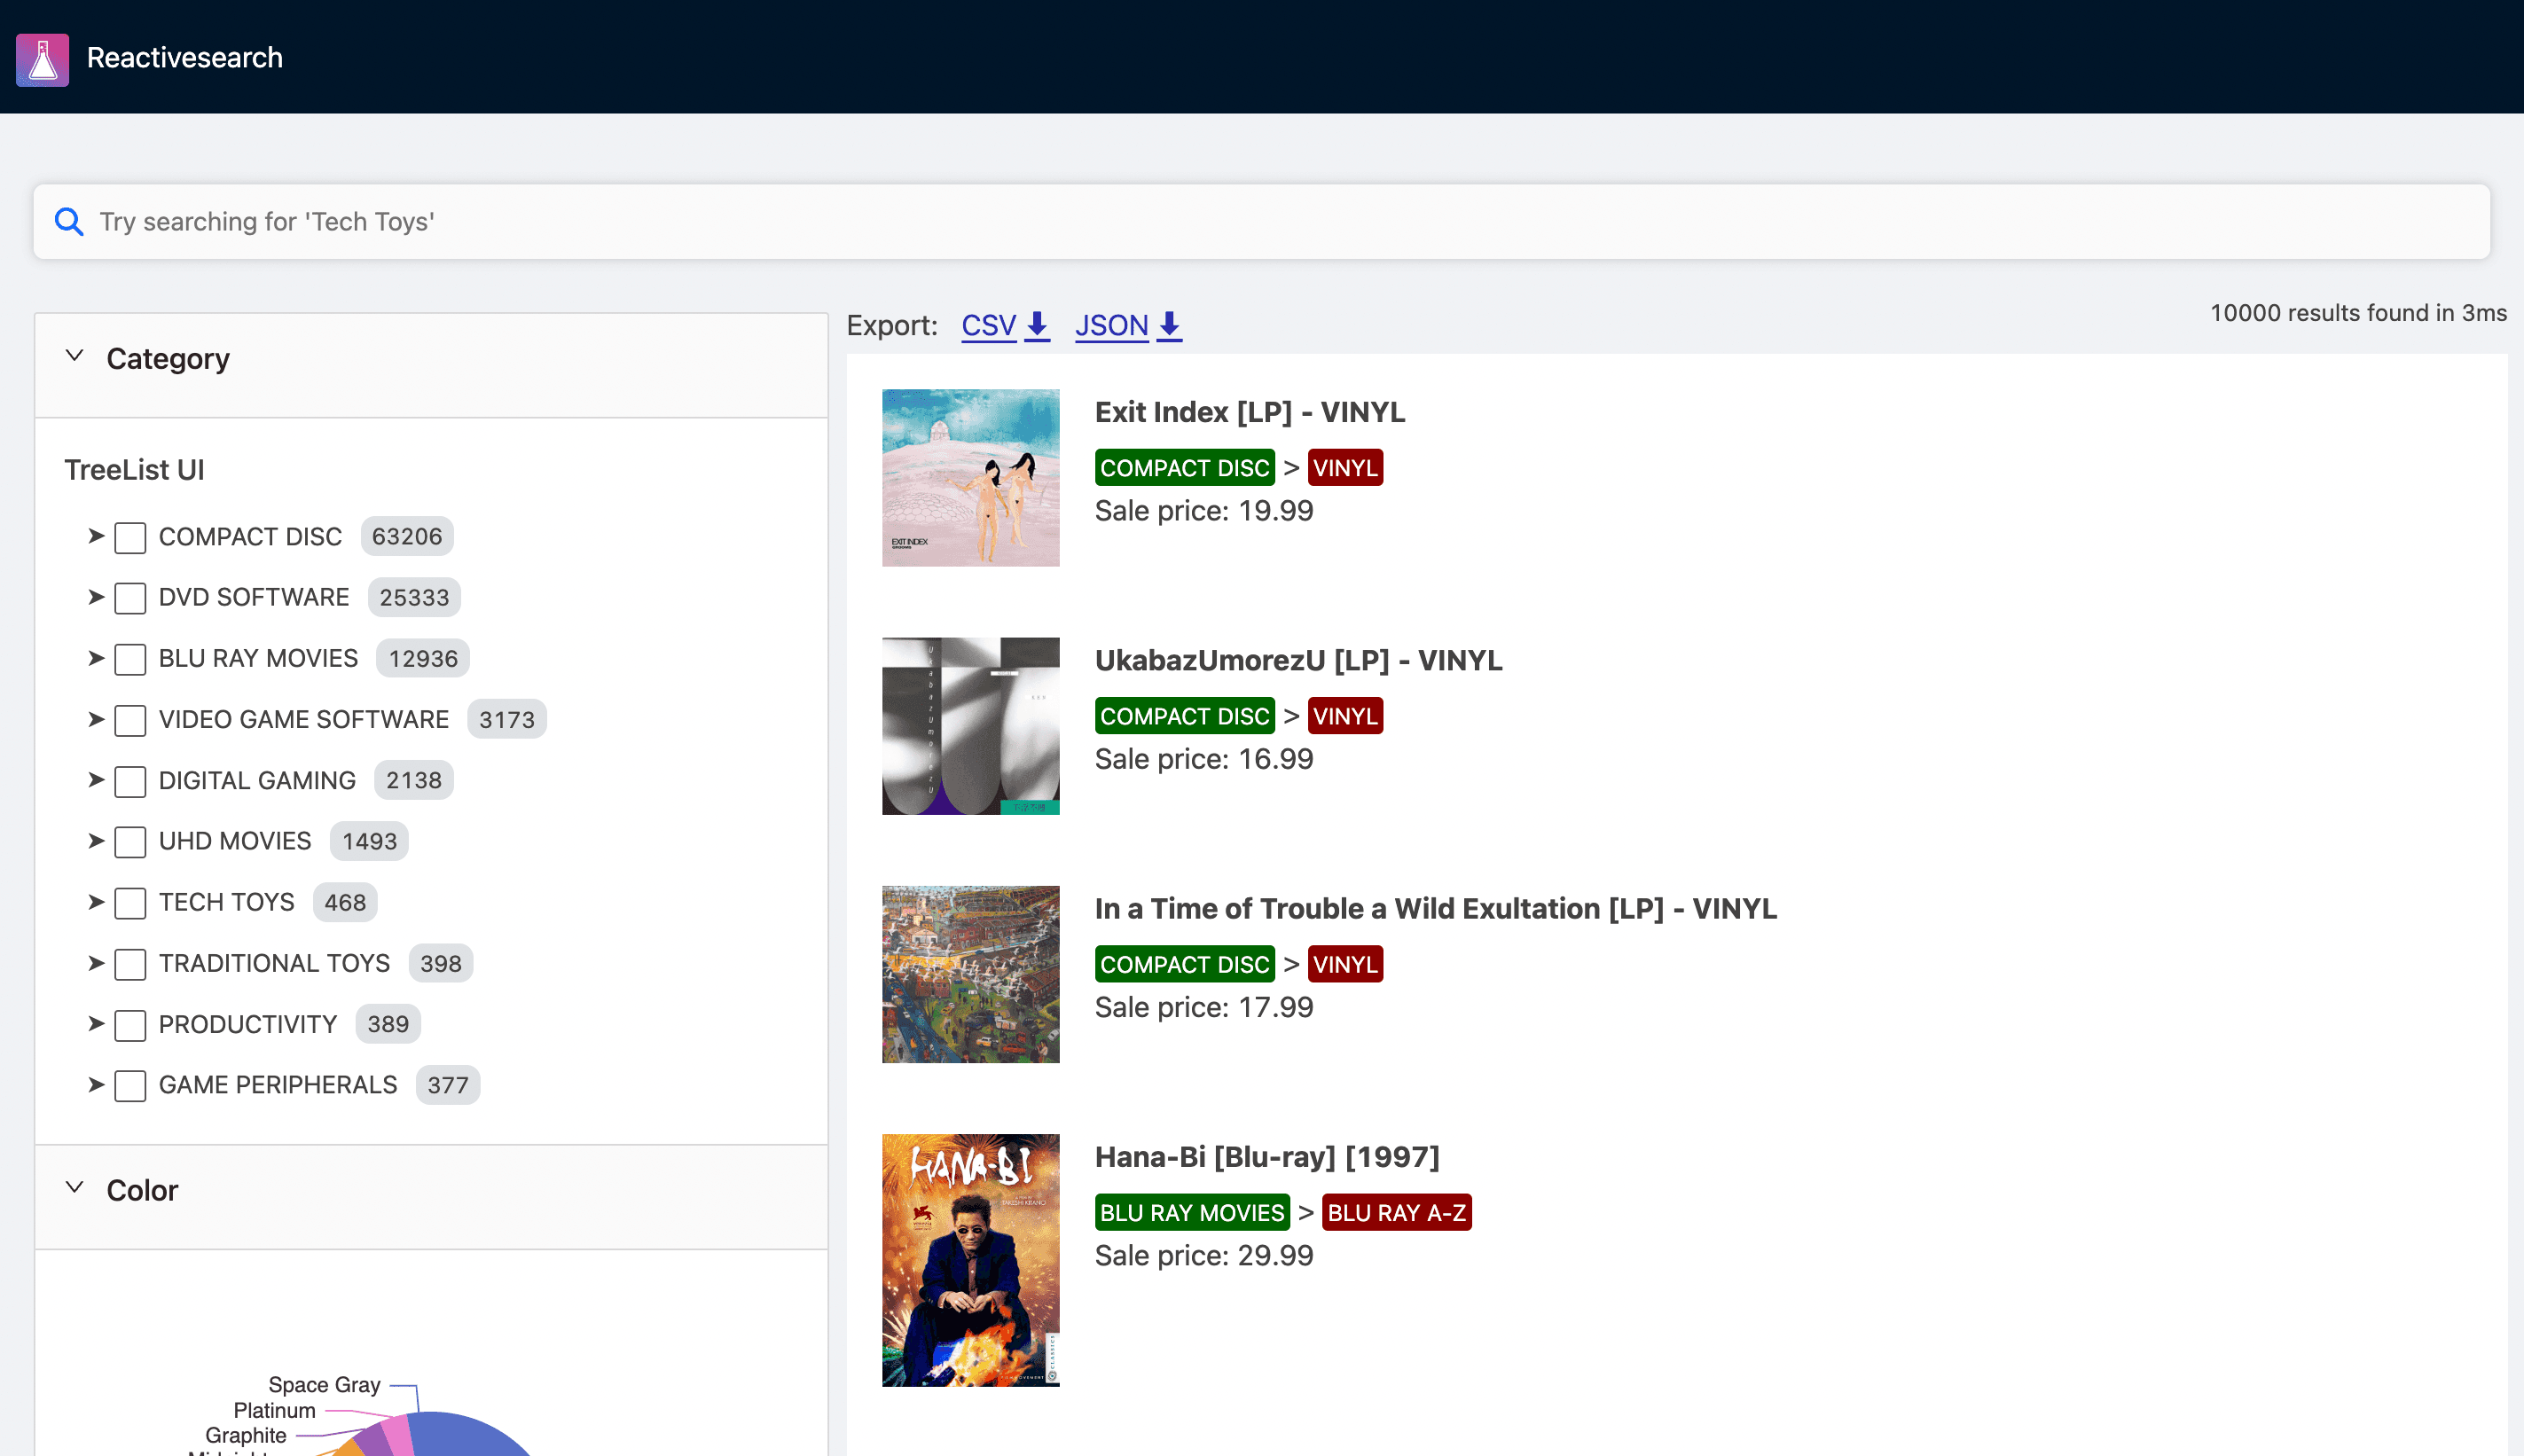
Then we are going to add a TreeList facet. The chart facet we added before, used a single dataField to query. So if someone selected "Black" color in the pie chart, it would query color.keyword and fetch all the products which match "Black" in their color field. Now, TreeList is a hierarchical facet. TreeList facet actually uses multiple fields to query. So you usually supply an array of fields to dataField prop. eg. [ 'class.keyword', 'color.keyword']. When a top-level field (class.keyword) is selected it selects all the sub-fields nested inside it. eg. If an option from top-level field like "Electronics" is selected then it would show all the products related to it regardless of its color. Users can then improve their filtering by selecting the sub-fields individually. Below we show the filter and its code. Note, we are using ['class.keyword', 'subclass.keyword'].
import { ReactiveChart, TreeList } from "@appbaseio/reactivesearch";
import { Collapse } from "antd";

const { Panel: CollapsePanel } = Collapse;

export default function CollapsibleFacets() {
  return (
    <Collapse defaultActiveKey={["Category", "Sub-Category"]}>
      <CollapsePanel header={<h3>Category</h3>} key="Category">
        <TreeList
          componentId="Category"
          showCount
          title="TreeList UI"
          showCheckbox
          mode="multiple"
          URLParams
          dataField={["class.keyword", "subclass.keyword"]}
        />
      </CollapsePanel>
      {/*other facet components*/}
    </Collapse>
  );
}
Export data and finishing
We can then add different facets as we want. We would add an additional chart facet. Also if we pass a prop called showExport to ReactiveList component we would be able to get the data shown in the list as .csv or .json format. Our final app would look like below.
Summary
I hope you enjoyed this tutorial. We introduced so many things in this post, which might get overwhelming. So, let's summarize what you need to keep in mind while building such an app.
Step 1: Setup a react project. (We used CRA for convenience) [CSB Link]
Step 2: Configure Reactivesearch [CSB Link]
Step 3: Adding facets
(a): Adding a chart facet [CSB Link]
(b): Adding a TreeList facet [CSB Link]
Step 4: Export data and finish [CSB Link]