Building Programmatic Charts UIs with ReactiveSearch
Are you looking to build a search UI with charts capabilities for your SaaS product? We will talk about creating programmatic charts with the ReactiveSearch UI library in this post. We will use ElasticSearch as the search engine backend and use the ReactiveSearch library for rendering the charts UI widgets.
ReactiveSearch now supports 5 built-in chart components: Pie Chart, Bar Chart, Histogram, Line, and Scatter, and comes with a generic component - ReactiveChart which can use any of the Apache E-charts UI components. You can read more about creating charts with ReactiveSearch over here.
Who is this for?
The need for the overall representation of data in a single glance is an essential requirement for all businesses. That’s where a charts UI comes into play.
A charts UI can be used to:
Enable your business team to visualize the important business metrics in a single glance,
Share performance and ROI reports with your clients,
Empower your customers and end-users to visualize metrics relevant to them,
Collate existing dashboards into a unifying dashboard.
There are dashboard builder tools such as Kibana and Grafana which let you create Elasticsearch-powered dashboards with no code. We recommend them whenever they fit your use case. However, they become limiting as soon as you need to programmatically filter and visualize the data, e.g. filter data for the logged-in user and set access controls on the data that’s visible, need to integrate other JavaScript code within your dashboard, or extend further by calling other backend routes.
What are we building?
We are going to build a drill-down charts dashboard app that has the following features:
An explore page where we can apply various filters and see the number of results it finds.
A search page where we can see the details of the results.
The explore page can drill down to the search page with all the facets selected on the page.
You can take a look at the live version below.
What do we need?
We would be using some tools to help make this complex task simple.
Dataset: To make a great UI we should have a good dataset. We would be using an e-commerce dataset that has a vast amount of product data across categories. We would also need an index to store the data.
You can set up and install an Elasticsearch server by following the official installation guide, or you can create a free account at reactivesearch.io which provides Elasticsearch hosting as a service and is easy to use. For simplicity, we will be using reactivesearch.io service to get started.
I’ve already created an index with the dataset. You can check out the dataset from above over here in the data browser tool Dejavu, which is built by reactivesearch.io.
ReactiveSearch — A declarative, props-driven UI library for querying and managing the search state and comes with over 30 UI component presets. This lets you customize both your queries and UIs to render in minutes and comes with extensive documentation.
Antd: A UI components library so that we don't have to focus on making our UI beautiful and consistent.
React Router: We are going to build a multi-page application, which would need to handle URL navigation. We would use
react-router-domfor that.
Let's get started
Initial Setup
We can bootstrap a react project by running yarn create react-app [app-name] or npx create-react-app [app-name]. This would create a project directory and initialize a package.json file in the root with all the necessary packages and scripts.
We would also need to install react-router-dom and antd library. This app was made using v4 of both libraries.
yarn add react-router-dom@4 antd@4
You would also need to install @appbaseio/reactivesearch which would help us create the search UI.
yarn add @appbaseio/reactivesearch
Below, shows the app after running the create react app command.
Building the Explore page
This is the main page of our app. This would contain different chart facets which we would use to narrow down our search results. We would be using @appbaseio/reactivesearch library which provides a range of facets.
Firstly, we need to modify our App.js file inside to configure our routing like below. We would create two pages, Explore.js and Search.js, inside a new directory. We would name the directory pages. Below routing configuration shows the Explore page on /explore , Search page on /search and for any other route, it would redirect to Explore page.
// src/App.js
import { BrowserRouter as Router, Switch, Route, Redirect } from 'react-router-dom';
import Explore from './pages/Explore';
import Search from './pages/Search';

function App() {
    return (
        <Router>
            <Switch>
                <Route exact path="/explore">
                    <Explore />
                </Route>
                <Route path="/search">
                    <Search />
                </Route>
                <Route path="/">
                    <Redirect to="/explore" />
                </Route>
            </Switch>
        </Router>
    );
}

export default App;
We would start building the Explore.js page now. First, we need to connect to the Elasticsearch index storing our dataset. For that, we would use ReactiveBase component from the library. The index name is best-buy-dataset and we have configured the credentials and URL. Since this is made using reactivesearch.io we are also passing enableAppbase to be true.
// Explore.js
import { ReactiveBase } from "@appbaseio/reactivesearch";
import React from "react";

function Explore() {
  return (
    <ReactiveBase
      app="best-buy-dataset"
      url="https://a03a1cb71321:75b6603d-9456-4a5a-af6b-a487b309eb61@appbase-demo-ansible-abxiydt-arc.searchbase.io"
      enableAppbase
    >
    {/* Our App goes here */}
    </ReactiveBase>
  );
}
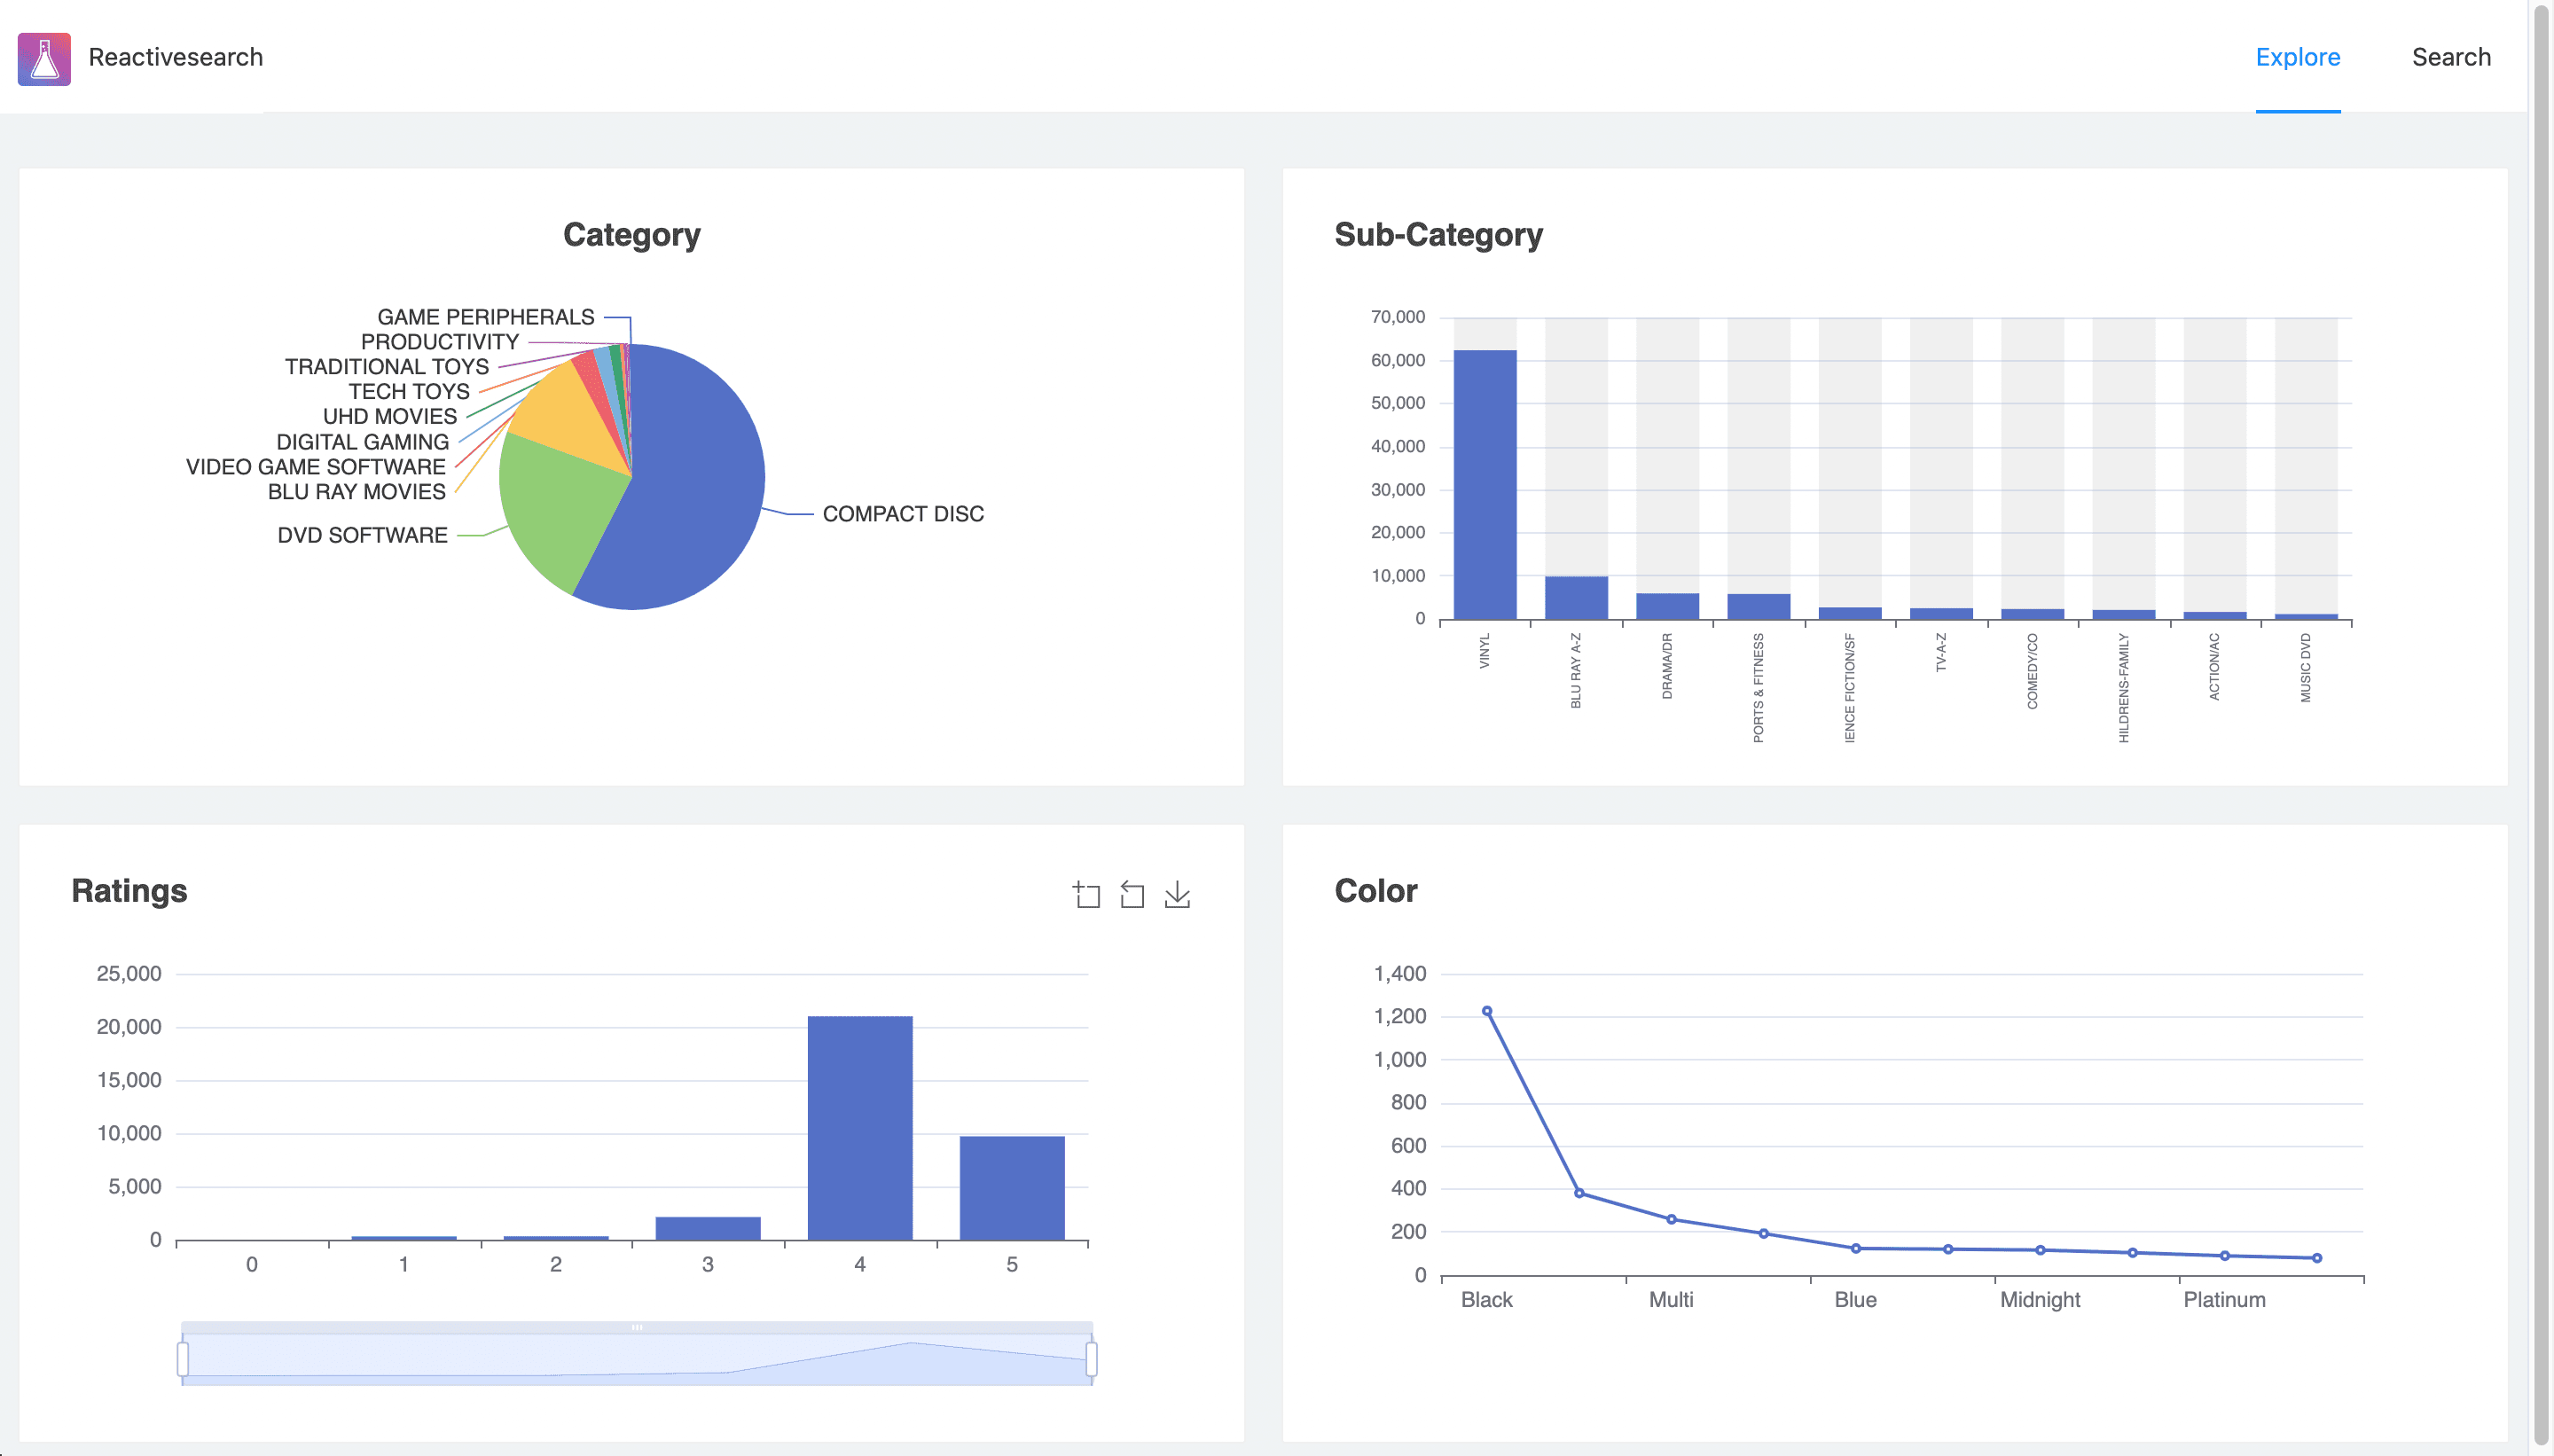
Then we are going to add a chart facet. For this, we would use ReactiveChart component and pass it required props to show us a pie chart. componentId differentiates this facet from others. dataField determines the field in your dataset/index on which you want to query. Finally, chartType is the chart you want to render. It can be pie, bar, line, etc. You can look at how we can configure different chart facets in the documentation.
// src/pages/Explore.js
import { ReactiveChart, ReactiveBase } from "@appbaseio/reactivesearch";

function Explore() {
  return (
    <ReactiveBase
      app="best-buy-dataset"
      url="https://a03a1cb71321:75b6603d-9456-4a5a-af6b-a487b309eb61@appbase-demo-ansible-abxiydt-arc.searchbase.io"
      enableAppbase
    >
      <ReactiveChart
        componentId="Category"
        dataField="class.keyword"
        chartType="pie"
      />
    </ReactiveBase>
  );
}
We can use the Card component from antd to wrap each chart facet which would make the UI look a little polished.
// src/pages/Explore.js
import { ReactiveChart, ReactiveBase } from "@appbaseio/reactivesearch";

function Explore() {
  return (
    <ReactiveBase
      app="best-buy-dataset"
      url="https://a03a1cb71321:75b6603d-9456-4a5a-af6b-a487b309eb61@appbase-demo-ansible-abxiydt-arc.searchbase.io"
      enableAppbase
    >
      <Card>
          <ReactiveChart
            componentId="Category"
            dataField="class.keyword"
            chartType="pie"
          />
      </Card>
    </ReactiveBase>
  );
}
You can see the complete Explore page. We would render an empty page for the Search page. We have also added some styles in src/App.css and imported them in src/App.js. You can check the source code in the codesandbox below.
Building the Search page
Now Search.js would be different from the Explore page, such that it would show the results with all the facets by the side. It would look like something below.
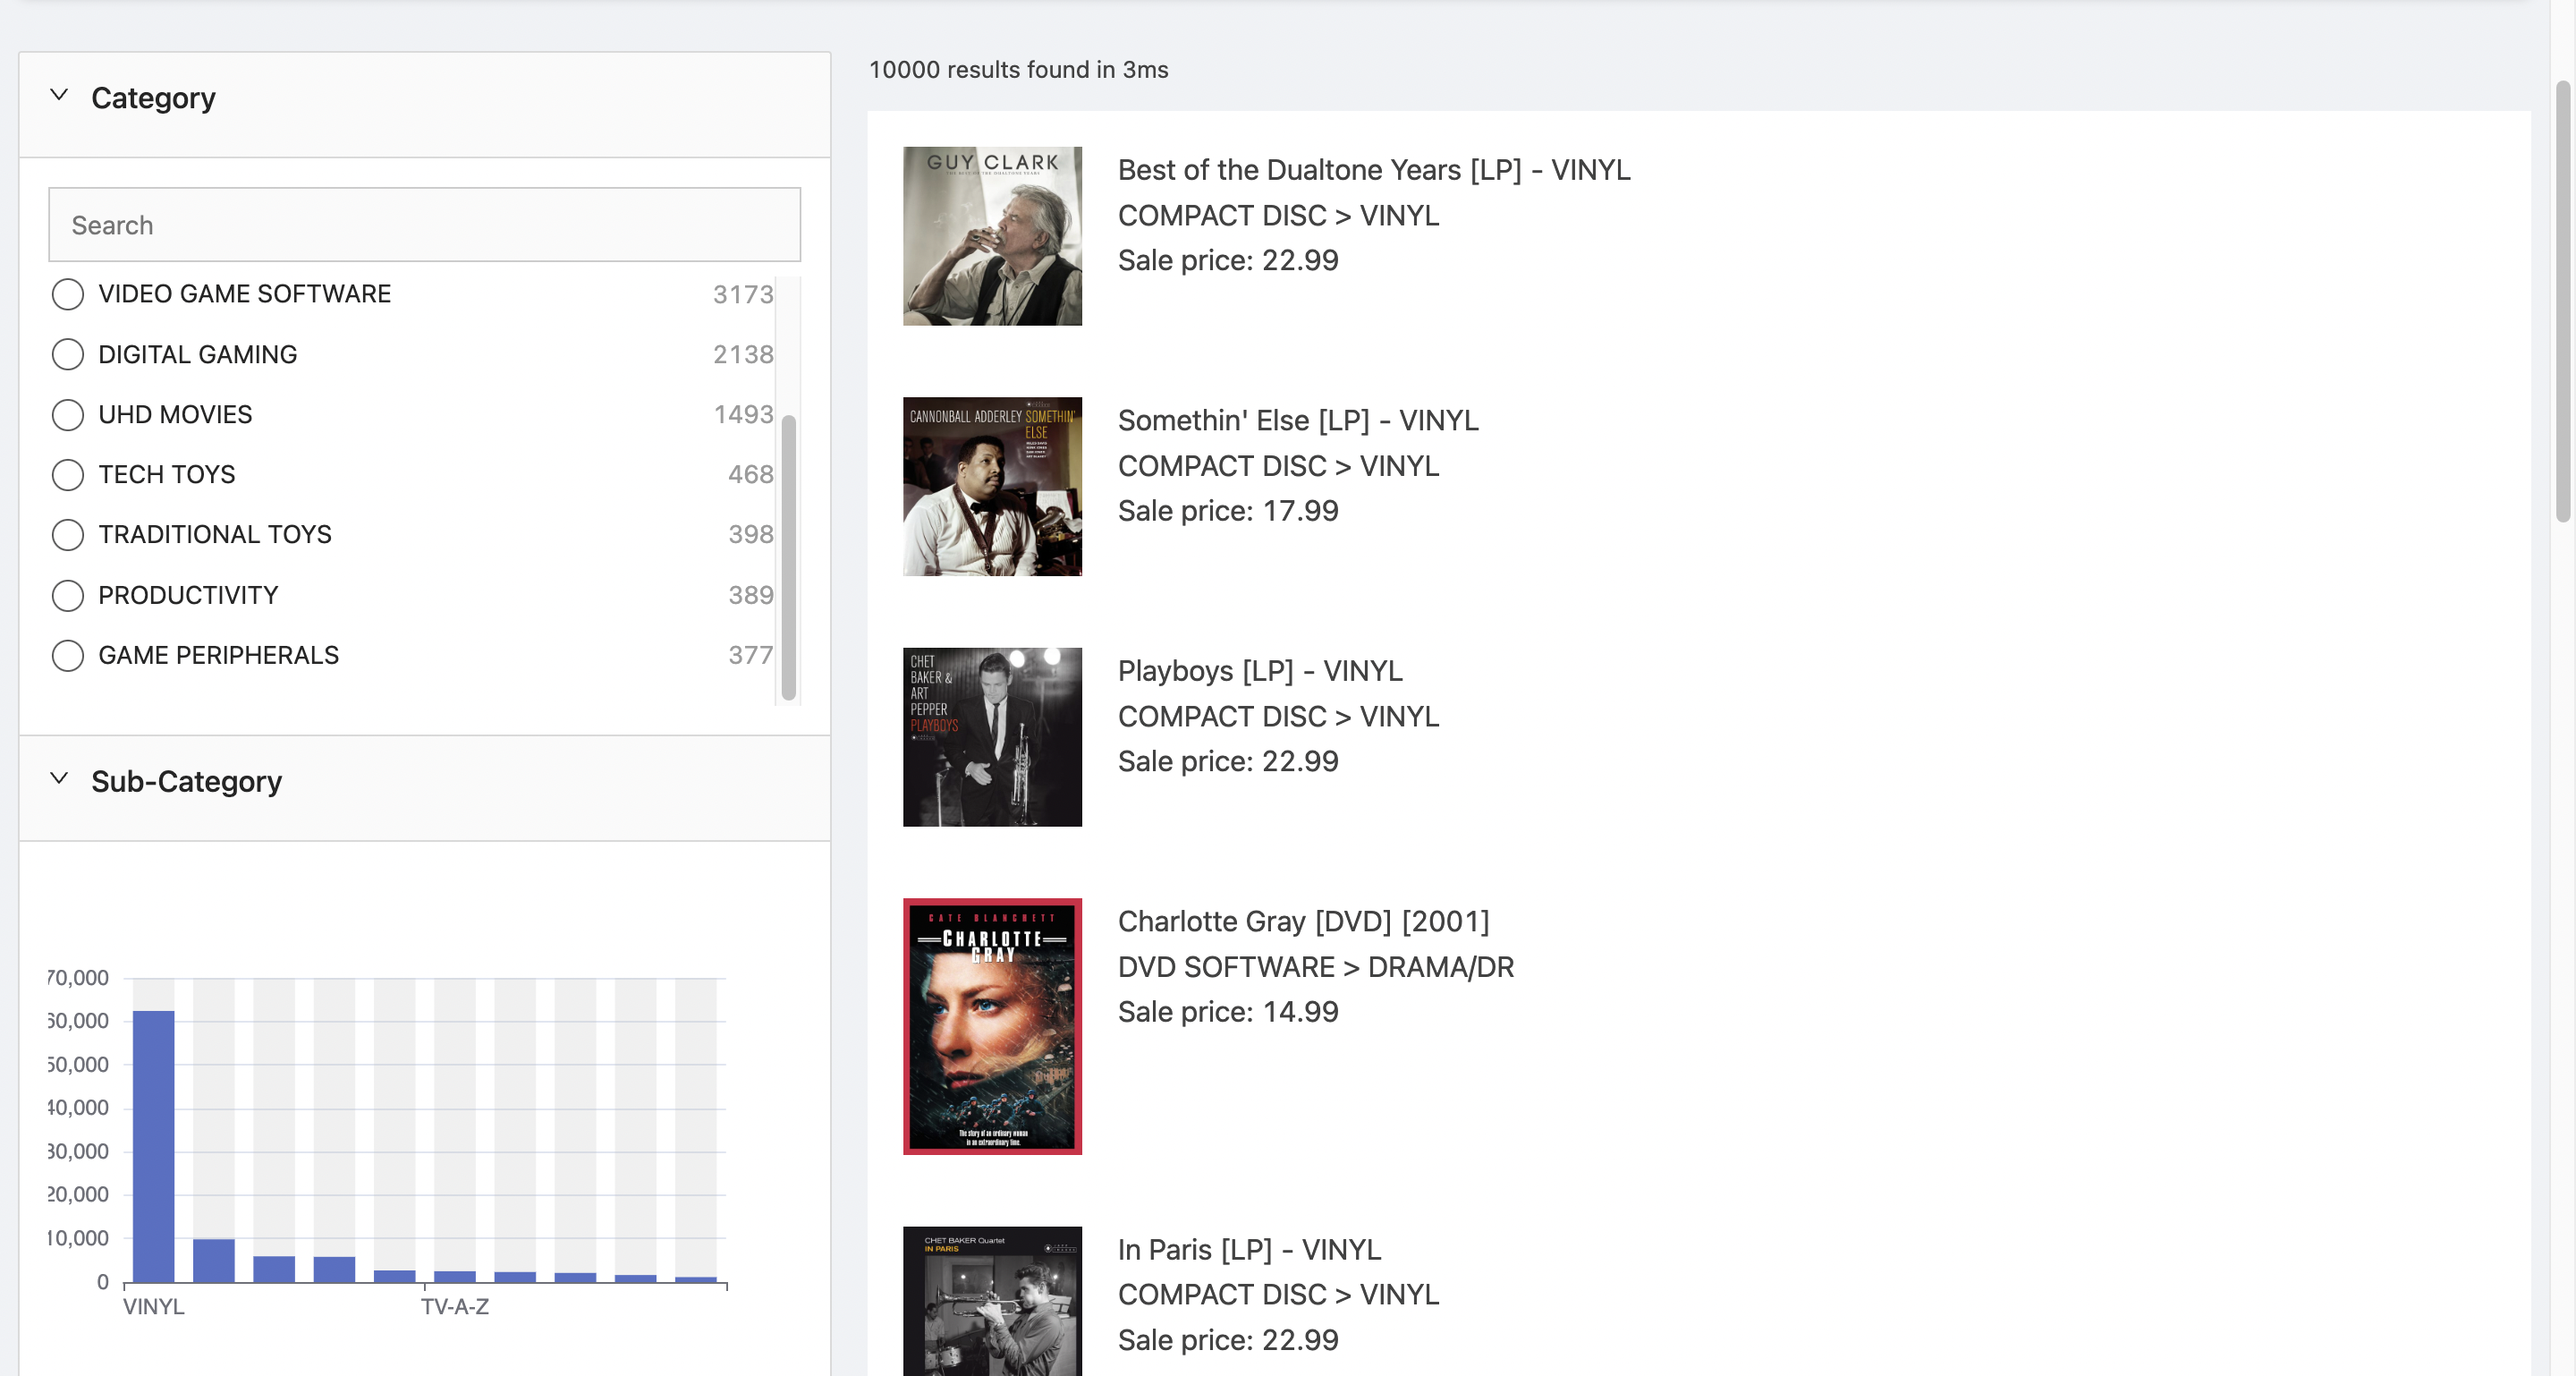
We would add facets on the side of the results. Firstly, create a new file under src/components and name it Facets.js. The facets we would configure are SingleList, BarChart, DynamicRangeSlider and LineChart. The final configuration should look like below.
// src/components/Facets.js
import {
  DynamicRangeSlider,
  ReactiveChart,
  SingleList,
} from "@appbaseio/reactivesearch";

export default function Facets() {
  return (
    <>
      <SingleList
        componentId="Category"
        dataField="class.keyword"
        URLParams
        loader="Loading..."
      />
      <ReactiveChart
        componentId="SubCategory"
        dataField="subclass.keyword"
        chartType="bar"
        type="term"
        URLParams
        useAsFilter
        loader="Loading..."
      />
      <DynamicRangeSlider
        componentId="ReviewAverage"
        dataField="customerReviewAverage"
        range={{ start: 0, end: 5 }}
        rangeLabels={(min, max) => ({
          start: min + " ⭐️",
          end: max + " ⭐️",
        })}
        loader="Loading..."
        showHistogram
        URLParams
      />
      <ReactiveChart
        componentId="Color"
        dataField="color.keyword"
        chartType="line"
        type="term"
        URLParams
        useAsFilter
        loader="Loading..."
      />
    </>
  );
}
// src/pages/Search.js
import { ReactiveBase, ReactiveList } from '@appbaseio/reactivesearch';
import React from 'react';
import Facets from '../components/Facets';

export default function Search() {

    return (
        <ReactiveBase
            app="best-buy-dataset"
            url="https://a03a1cb71321:75b6603d-9456-4a5a-af6b-a487b309eb61@appbase-demo-ansible-abxiydt-arc.searchbase.io"
            enableAppbase
            initialQueriesSyncTime={1000}
        >
             <Facets />
        </ReactiveBase>
    );
}
We also have to show results on the right side. For that, we are going to use another component called ReactiveList. Not only does it show results but it also updates itself when one of the facets changes. It also gives us a nice interface to render data in our dataset.
We would add a ReactiveList by configuring it's componentId, dataField, and renderItem method. We've already seen what componentId and dataField do. As for the renderItem method, it is a method that passes down each individual document from the Elasticsearch index which you can use to customize the look and feel. Apart from that we also configure an additional property called react. This tells what facet components would update the results in this list. We should pass the componentId of the facets when doing this. You can read more about configuring ReactiveList component in the documentation. We also use Col and Row layout components from antd which would help us to create responsive layouts easily.
import { ReactiveBase, ReactiveList } from "@appbaseio/reactivesearch";
import { Col, Row } from "antd";
import React from "react";
import Facets from "../components/Facets";

export default function Search() {
  return (
    <ReactiveBase
      app="best-buy-dataset"
      url="https://a03a1cb71321:75b6603d-9456-4a5a-af6b-a487b309eb61@appbase-demo-ansible-abxiydt-arc.searchbase.io"
      enableAppbase
      initialQueriesSyncTime={1000}
    >
      <Row>
        <Col xs={24} md={8} className="p10">
          <Facets />
        </Col>
        <Col xs={24} md={16} className="p10">
          <ReactiveList
            componentId="SearchResult"
            dataField="original_title"
            className="result-list-container"
            from={0}
            size={5}
            renderItem={(data) => {
              return (
                <div className="resultItem" key={data._id}>
                  <img
                    src={data.image}
                    alt="Book Cover"
                    className="resultItem__img"
                  />
                  <div className="resultItem__body">
                    <div className="book-header">{data.name}</div>
                    <div className="flex column justify-space-between">
                      <div>
                        <div>
                          <span className="resultItem__category">
                            {data.class}
                          </span>{" "}
                          <span>></span>{" "}
                          <span className="resultItem__subCategory">
                            {data.subclass}
                          </span>
                        </div>
                        <div className="ratings-list flex align-center">
                          Sale price: <span className="">{data.salePrice}</span>
                        </div>
                      </div>
                    </div>
                  </div>
                </div>
              );
            }}
            react={{
              and: [
                "Category",
                "SubCategory",
                "Color",
                "ReviewAverage",
                "SearchBox",
              ],
            }}
            includeFields={[
              "class",
              "subclass",
              "name",
              "image",
              "salePrice",
              "categoryPath",
            ]}
          />
        </Col>
      </Row>
    </ReactiveBase>
  );
}
We would also add a SearchBox from @appbaseio/reactivesearch. You can check the look and feel of the page with all the components below.
Drill down behavior
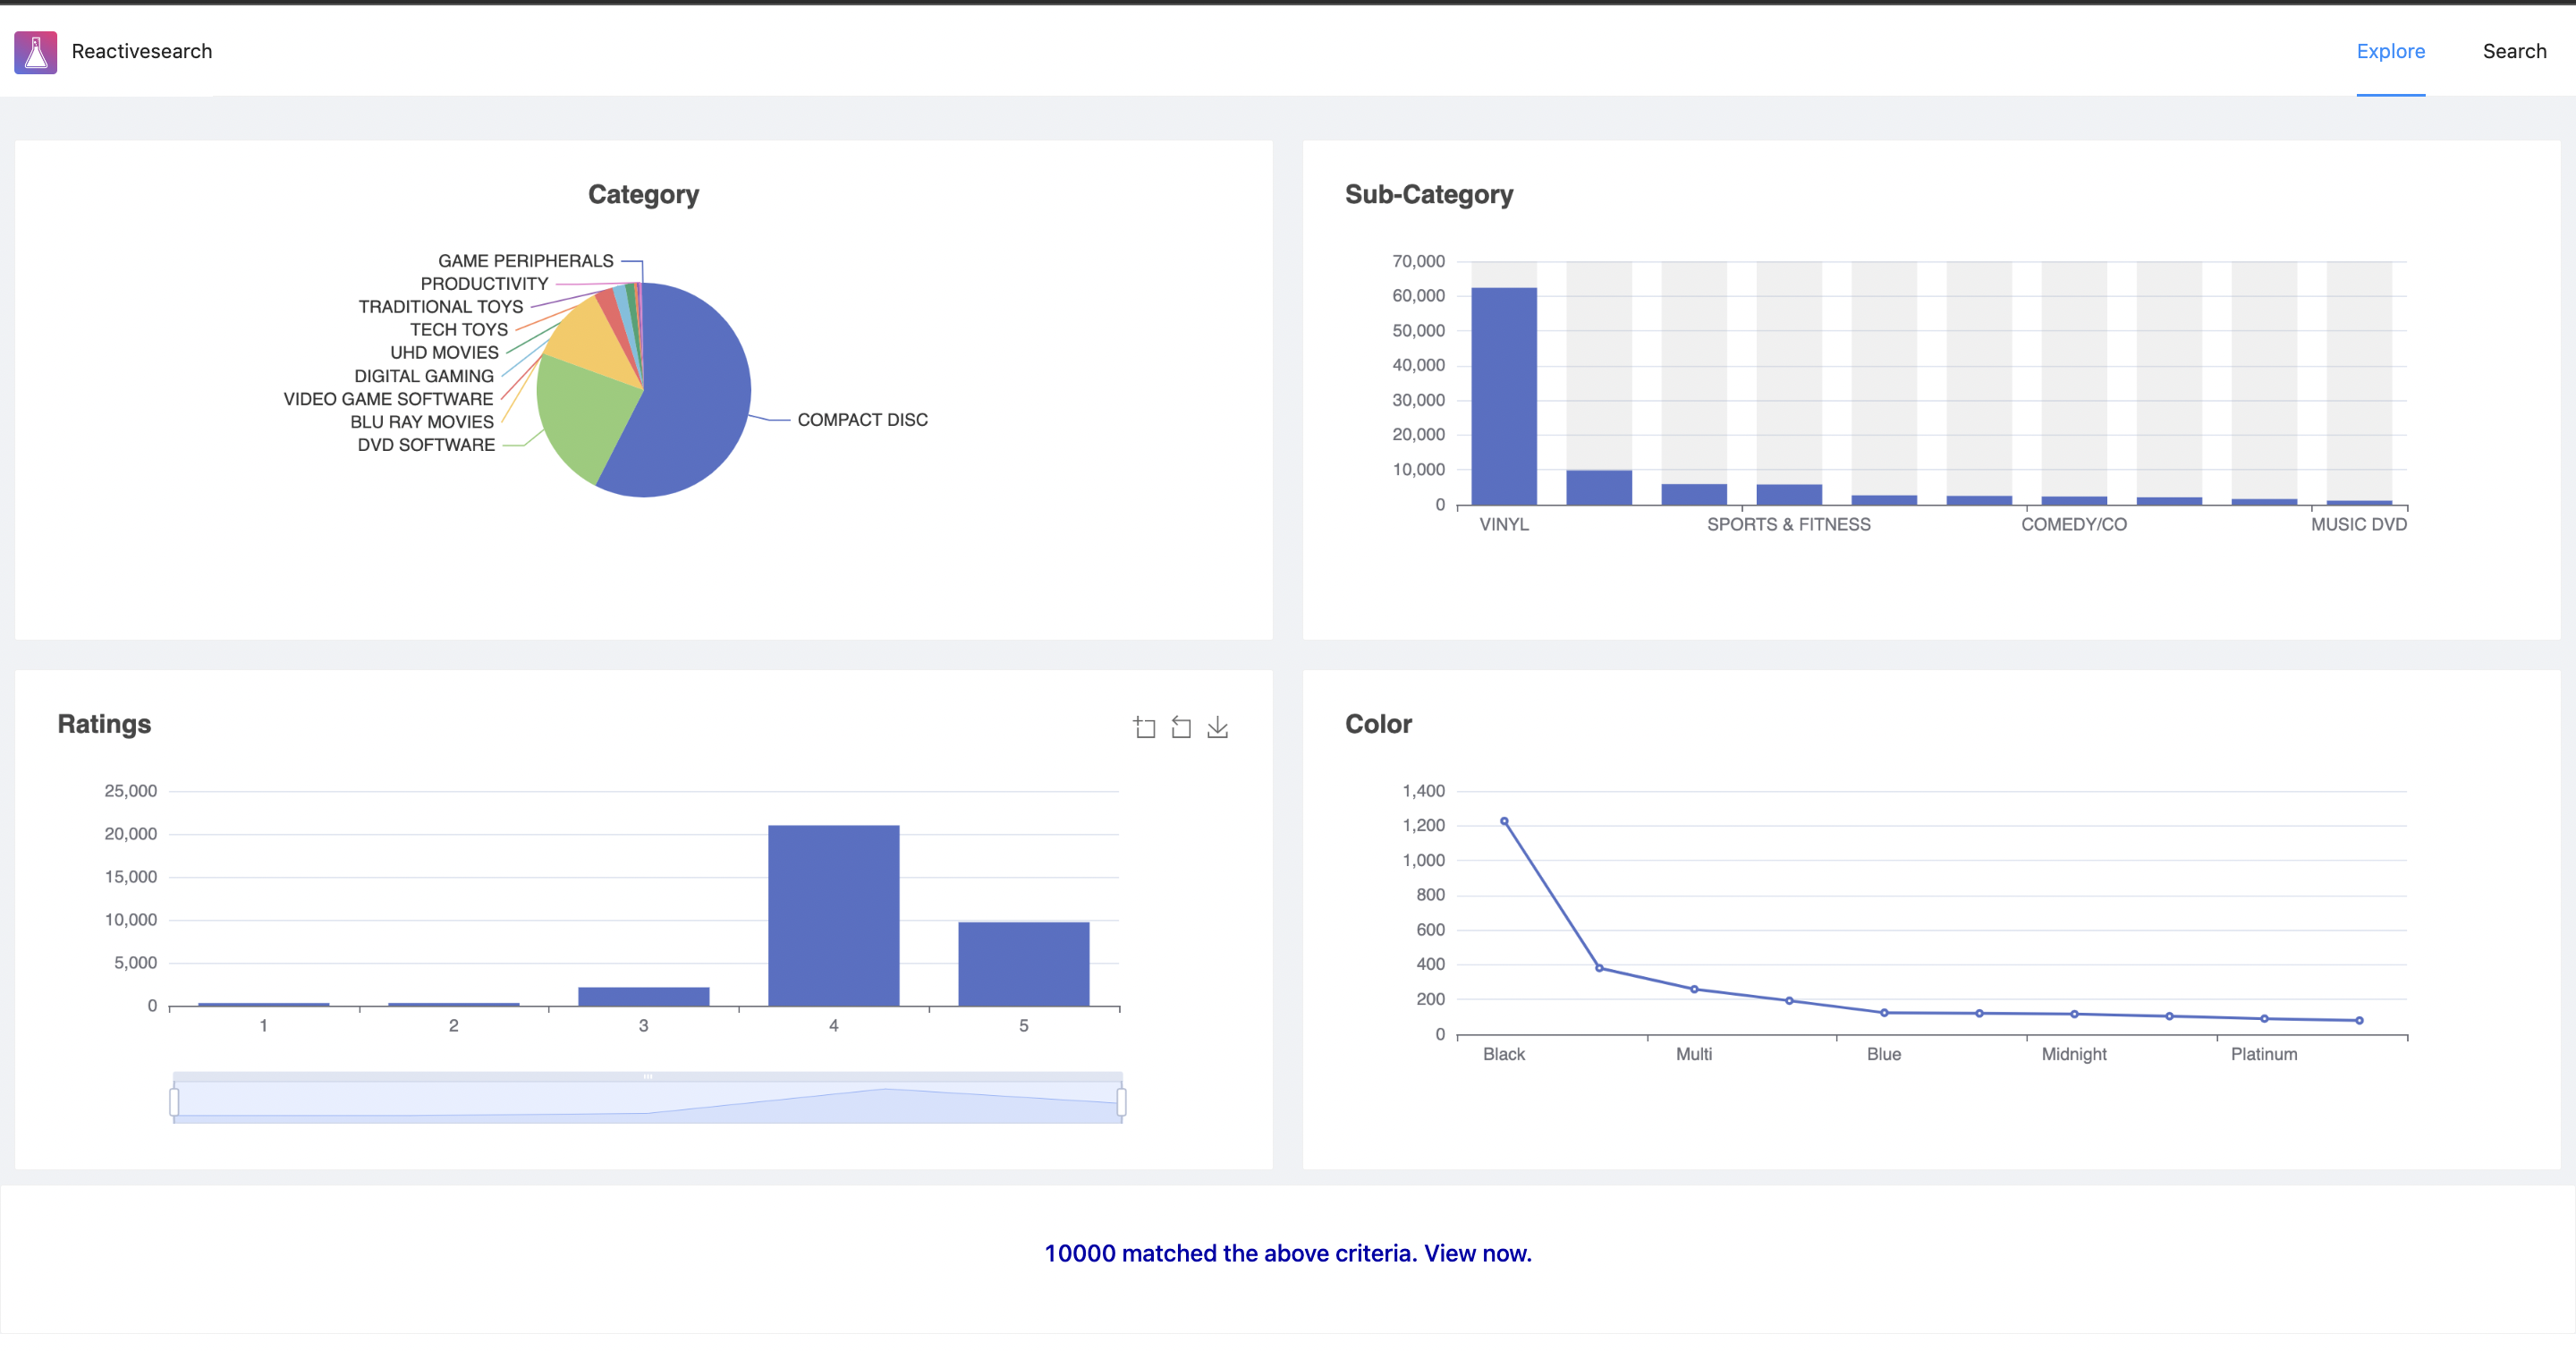
We have built both pages. Now we need to connect them. We would add a card at the bottom, which would show the number of results filtered by charts, clicking which would lead to the search page.
For that, we would also use a ReactiveList component. We would use the render method to customize our render. It is different from renderItem such that it gets all the documents at once. It also gets some additional props useful to display the result stats such as the total number of documents. We would also hide the default result stats by passing showResultStats as false and hide pagination as well.
We would also add an onClick method which would take us to the search page. The onclick handler would apply all the filters from the Explore page to the Search page.
Since the above functionality relies on URL params to pass this information, we would need to pass URLParams prop as true in all the facet components on both pages.
// src/pages/Explore.js
// ... import statements

function Explore({ history }) {
    return (
        <ReactiveBase
            {...configuration}
        >
        {/* Chart facets */}
        <Row>
                <ReactiveList
                    componentId="ListComponent"
                    dataField="albumTitle"
                    pagination={false}
                    infiniteScroll={false}
                    showResultStats={false}
                    renderNoResults={() => null}
                    react={{ and: ['Category', 'SubCategory', 'ReviewAverage', 'Color'] }}
                    className="fullWidth"
                    render={({ data, ...props }) => {
                        return (
                            <Card
                                className="fullWidth"
                                onClick={() => {
                                    const urlLocation = new URL(window.location.href);
                                    const urlSearchParams = new URLSearchParams(urlLocation.search);
                                    history.push(`/search?${urlSearchParams}`);
                                }}
                            >
                                <h1 className="resultsCard">
                                    {!props.loading
                                        ? `${props.resultStats.numberOfResults} matched the above criteria. View now.`
                                        : 'View Search Results'}
                                </h1>
                            </Card>
                        );
                    }}
                />
            </Row>
        </ReactiveBase>
    );
}
Congratulations! We've created a super-duper charts dashboard with a search interface. You can look at the complete working app below.
Summary
I hope you enjoyed this tutorial. We introduced so many things in this post, which might get overwhelming. So, let's summarize what you need to keep in mind while building such an app.